
August update: COVID-19’s impact on real estate advertising on Facebook
Share
Schedule a 30-min marketing strategy call with our team
This is our fifth continuation of our analysis showing COVID-19’s impact on Real Estate Advertising on Facebook. Each month, our team will continue to analyze month-over-month results from a subset of our real estate business.
To date, we analyzed over 420,000,000 ad impressions and behaviors that have generated over 220,000 leads. Below, alongside our first four data sets, you will find the results of our latest analysis showing the changes in result metrics when comparing June data to July data.
Analysis Results
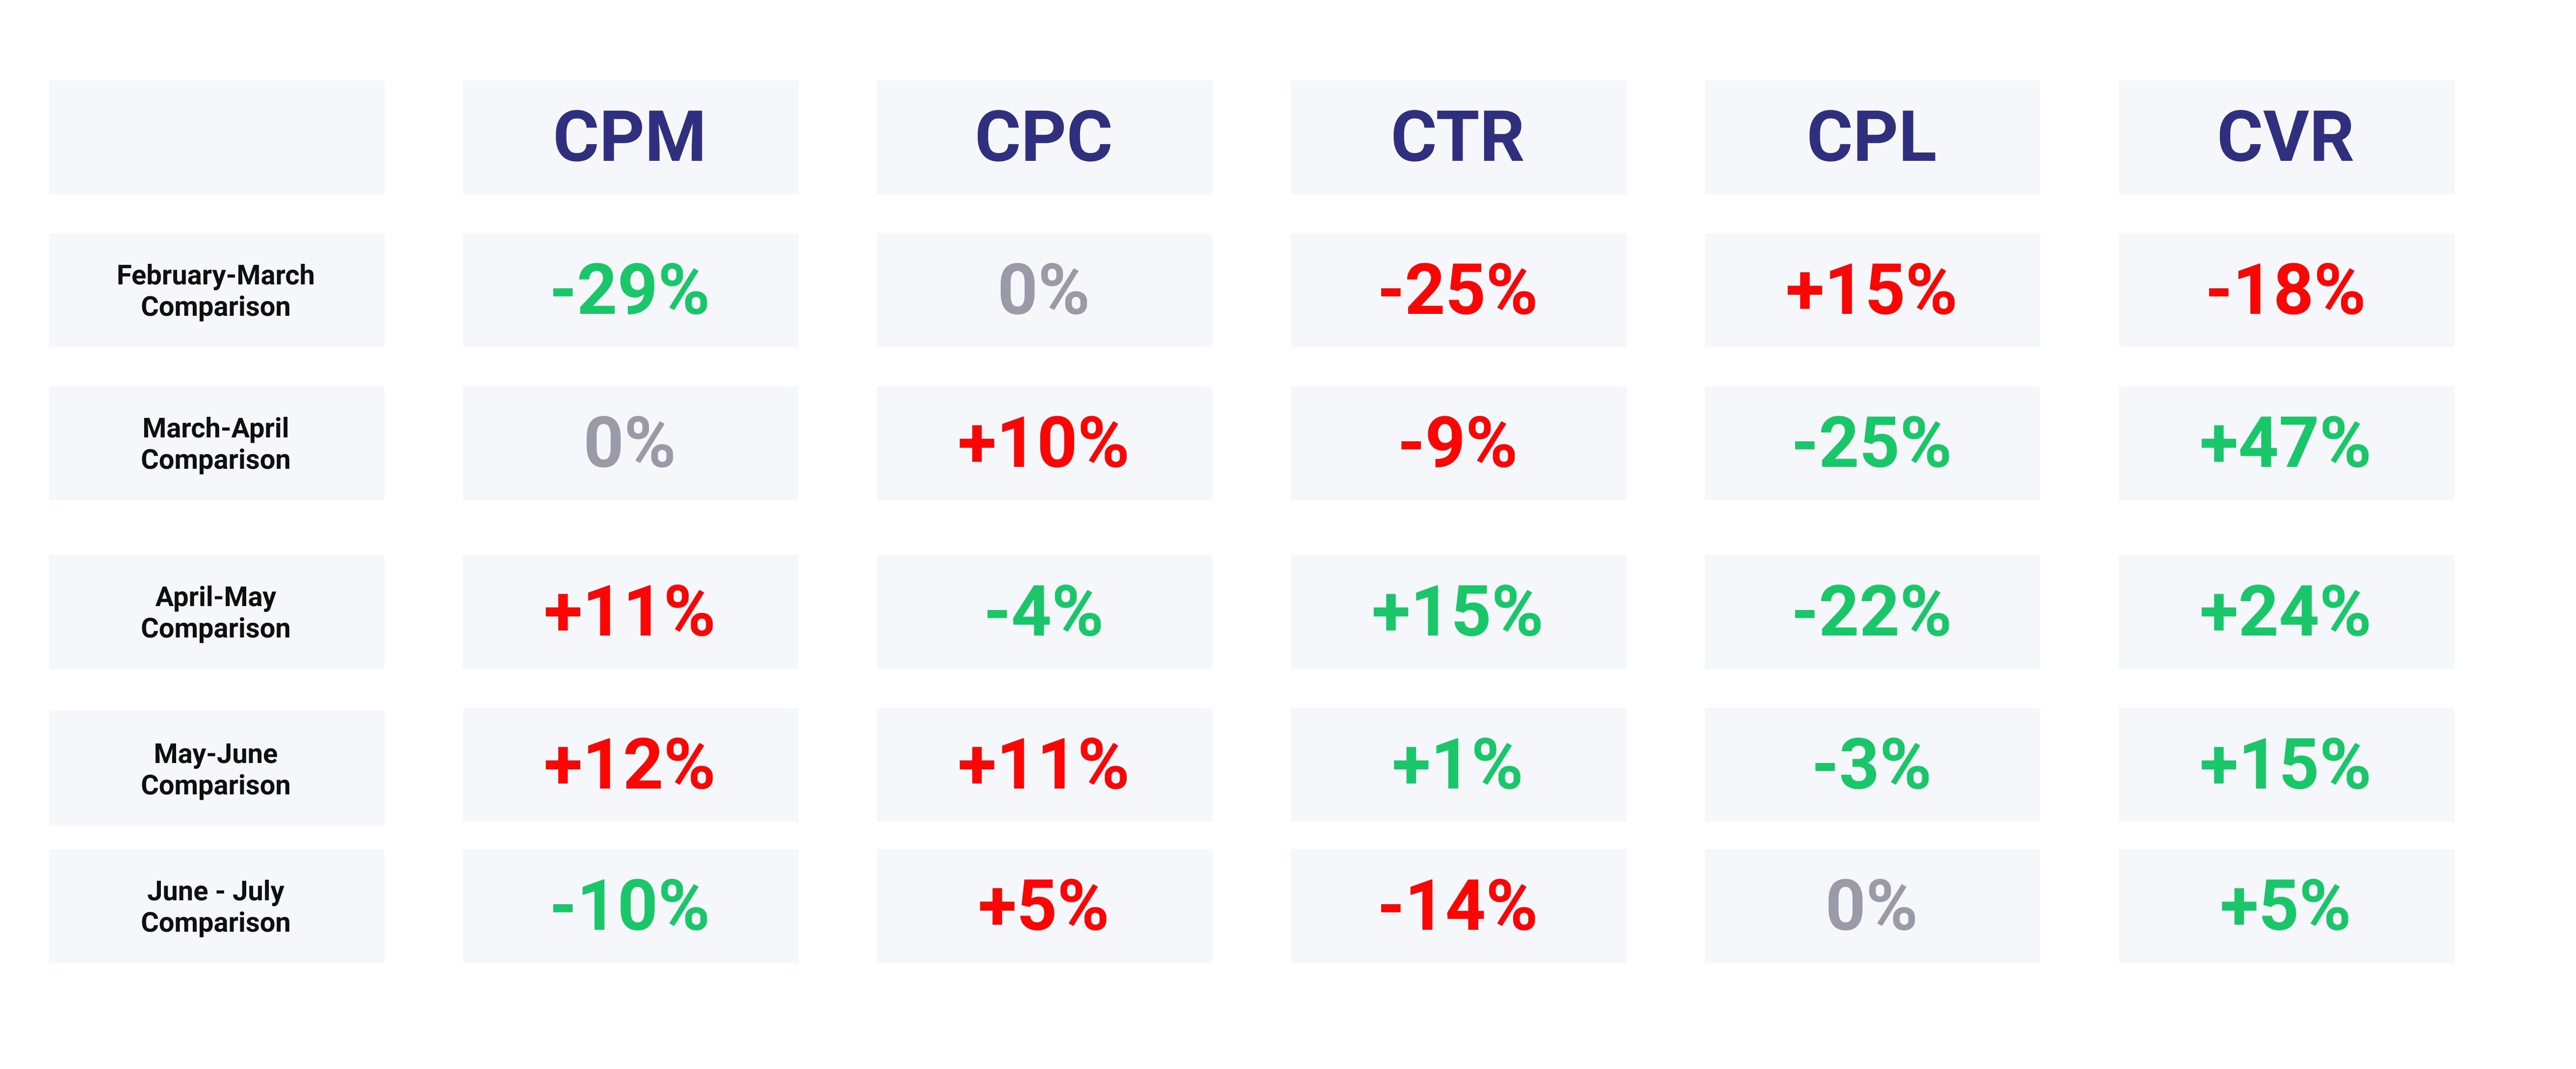
As you can see in the far right column, lead conversion rate (CVR) continues to be the focal point of analysis showcasing another MoM gain. However, this is the first single digit CVR increase we have seen since April.
The cost of media (CPM) decreased by 10% MoM, this is the first decrease in media costs that we have recorded since our initial analysis. We normally see increases in media costs in the months that end a quarter (June ended Q2 2020) due to more advertisers increasing spend to ensure quarterly budgets are exhausted, therefore we believe that the 10% decline is not due to COVID but due to seasonality. The below seasonality analysis shows a 10% decrease in CPM during this same time period in 2019.
After having two months of positive gains, Click Through Rate (CTR) took a step backwards with a 14% MoM decrease, signaling a fewer amount of people displaying home browsing behavior. The seasonality analysis below shows a 18% increase in CTR during the same period in 2019, therefore we believe that the decline in CTR is due to COVID-19’s impact.
Seasonality Comparison
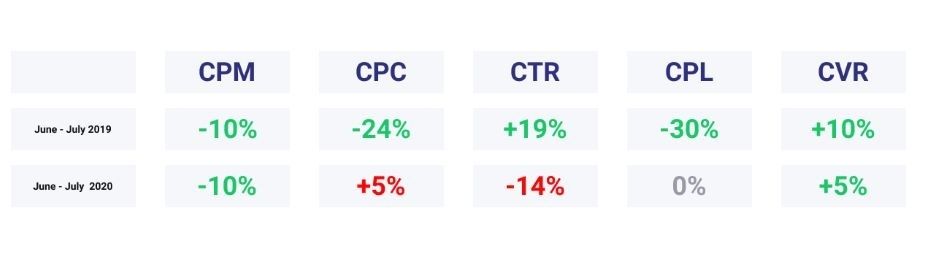
In past years, July showcases the peak of Facebook Advertising performance metrics in the Real Estate industry due to the summer home buying season. This claim is showcased in the above 2019 result data, explicitly with the monumental gains/decreases in CPC, CTR, and CPL.
Using the above year-over-year seasonality comparison it’s easy to identify the impact that COVID-19 is having. CPM is showing the same decrease YoY (due to June being the end of Q2) and the variance in CVR is not extreme, however, CPC, CTR, and CPL metrics tell different stories.
Focusing on CTR, 2019’s 19% gain shows a large increase in people’s willingness to click and browse listings. This early stage home buying/selling behavior was substantially different in 2020.
Correlation Between Pending Home Sales And Lead Conversion Rates?
In our last analysis we identified that the MoM increase in the National Association of REALTOR’s Pending Home Sales Index comparing April to May (44.3%) was extremely similar to the MoM Facebook Lead Ad conversion rate that we measured Comparing March to April (47%).
Our team is tracking this comparison to see if the PHS numbers continue to be similar to the MoM Facebook Lead Ad conversion rate difference.
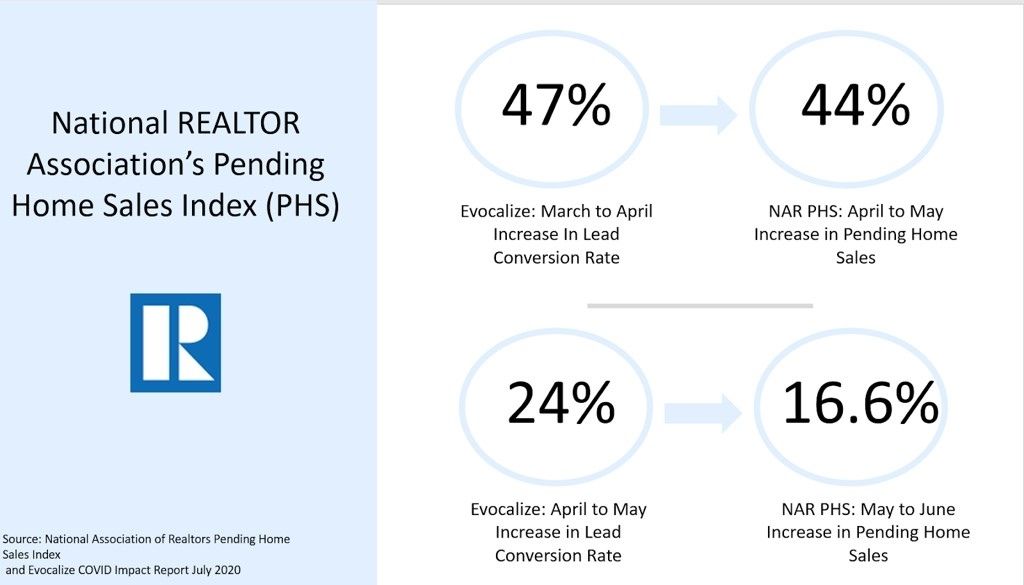
The above image shows that the difference between our CVR data and the PHS number widens when compared to our original discovery. We will continue to monitor these figures over the next few months.
Lead Conversion Rate Trend Line Through COVID Crisis
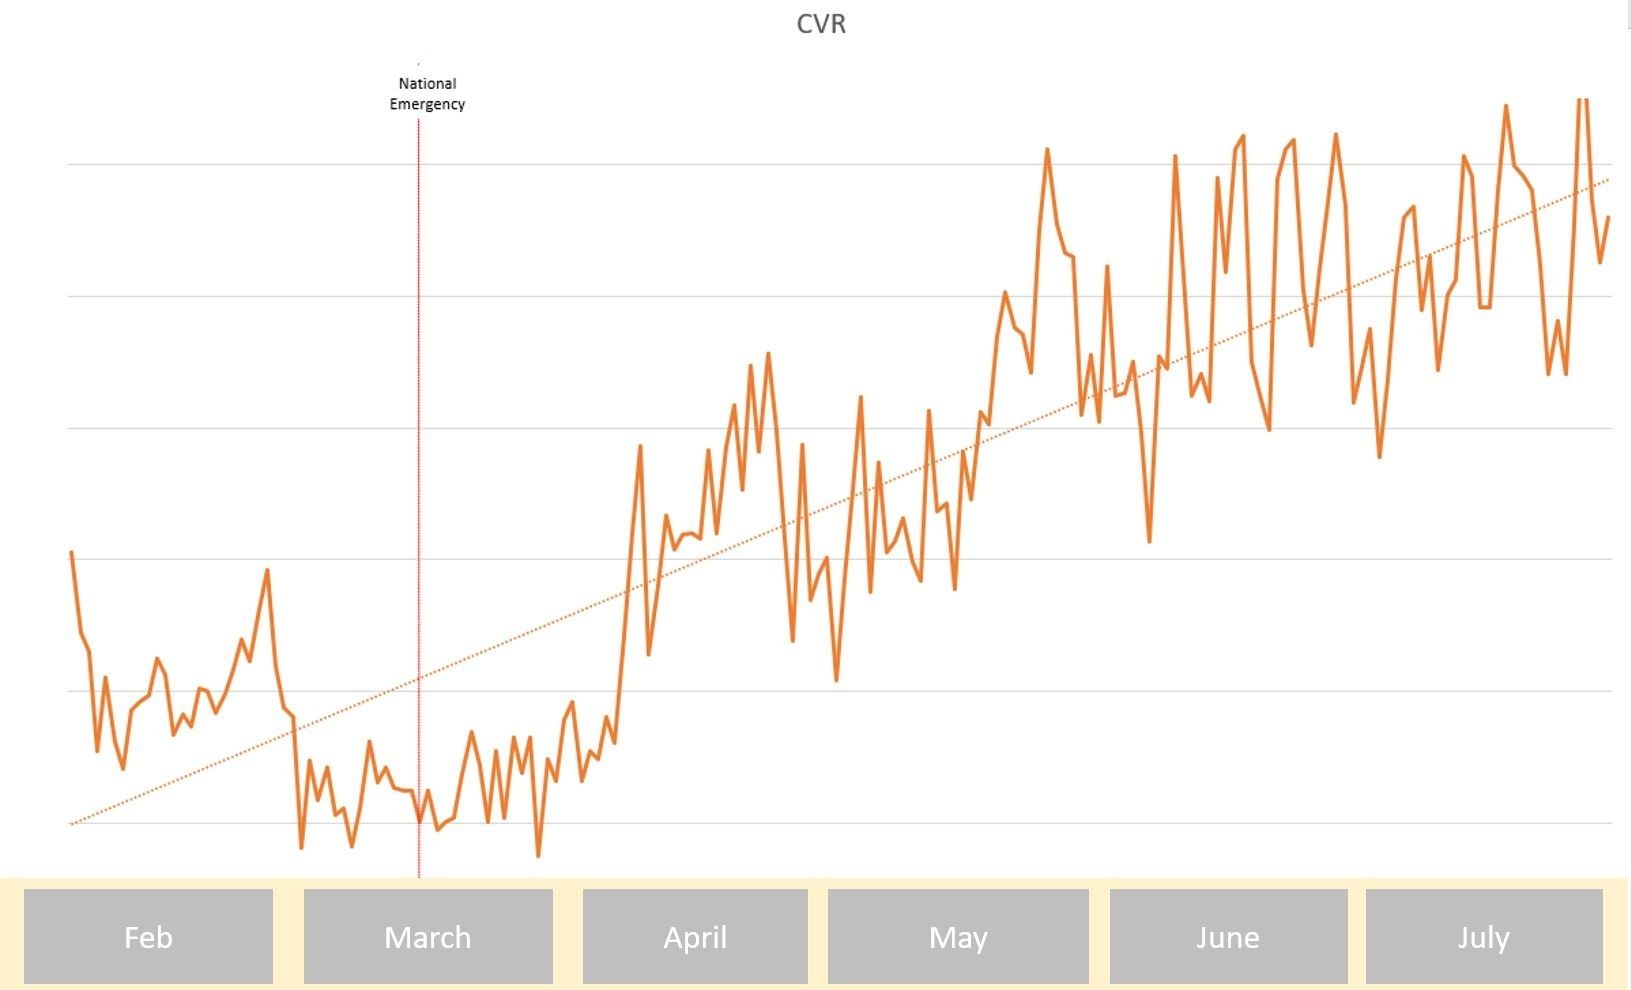
Lead conversion rates continue to skyrocket through the COVID crisis
Cost Per 1,000 Impressions Trend Line Through COVID Crisis
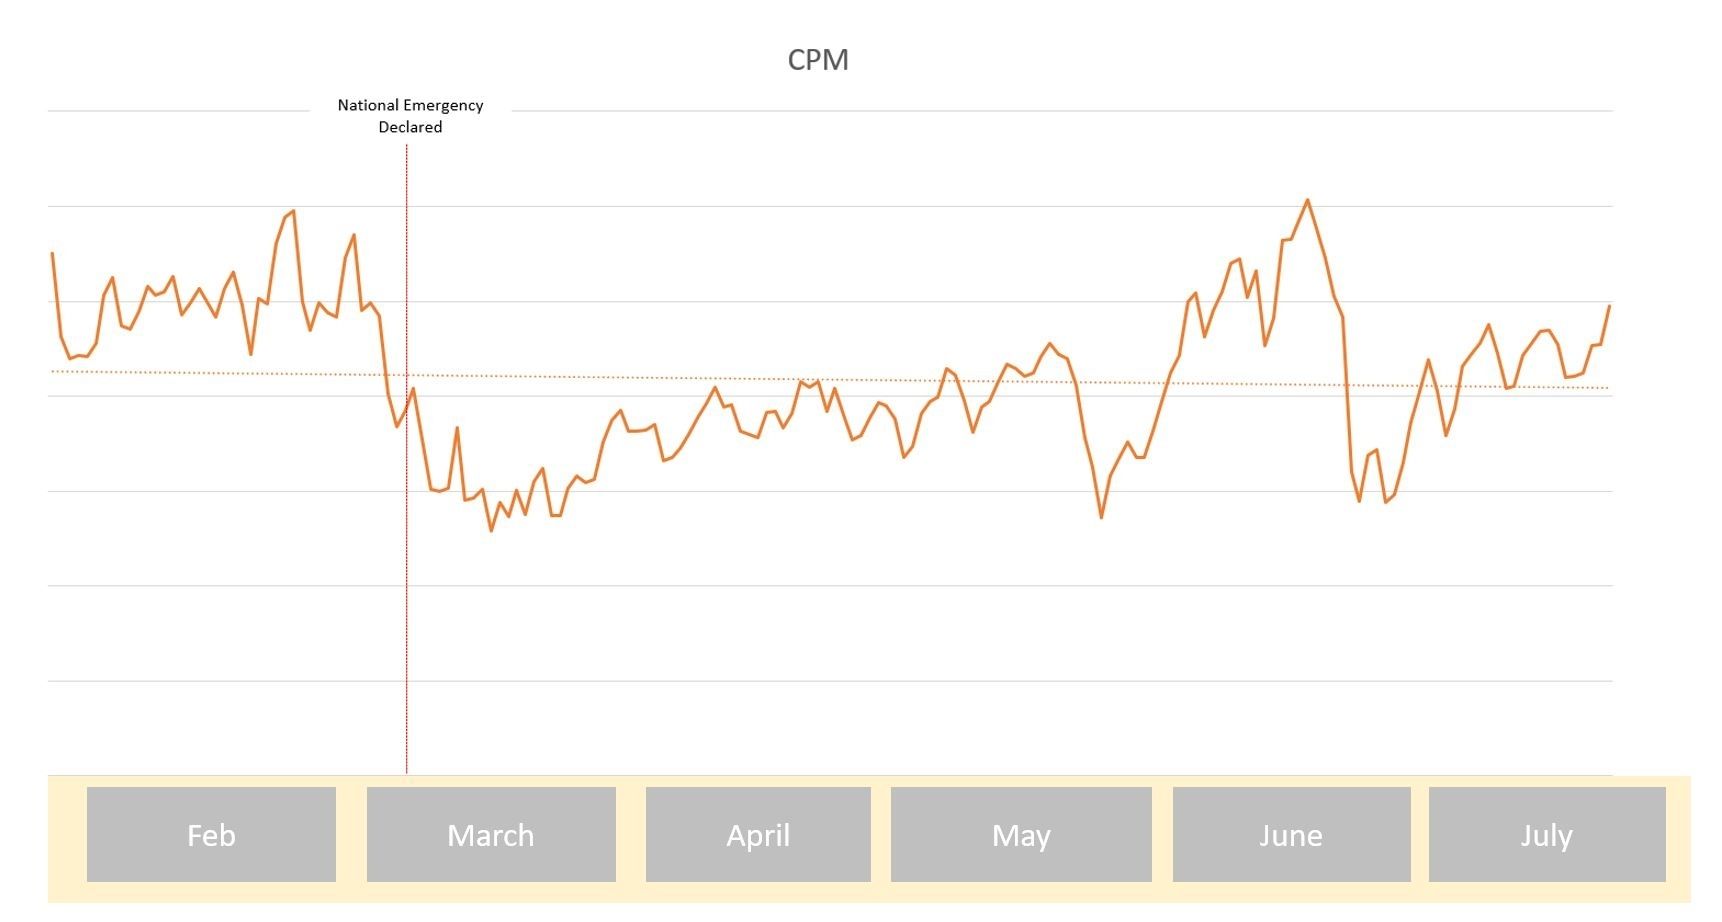
The increase in CPM during the month of June is clearly identified. This is due to advertisers increasing spend so they can hit their quarterly targets. In July, CPM returned to pre-COVID lows.
Share


Subscribe to our blog
Don’t miss a beat in the fast-changing local digital marketing landscape — sign up to stay ahead of the curve!