Industry Report: Real estate advertising on Facebook January 2021 issue
Share
Schedule a 30-min marketing strategy call with our team
When it comes to Real Estate advertising on Facebook, 2020 was an unprecedented year. With over 1 Billion ad impressions analyzed and behaviors that generated over 1,000,000 leads through Evocalize technology, our team and partners can say this with conviction.
In this report, we conclude our annual analysis that showcases the month-over-month change of key Facebook advertising performance metrics. Moving into 2021, our team will continue to monitor real estate advertising performance trends, but will move to a quarterly publishing cadence. Our new quarterly report will drill into areas beyond performance metrics to give insight into Real Estate Advertising on Facebook.
2020 Month over Month Analysis
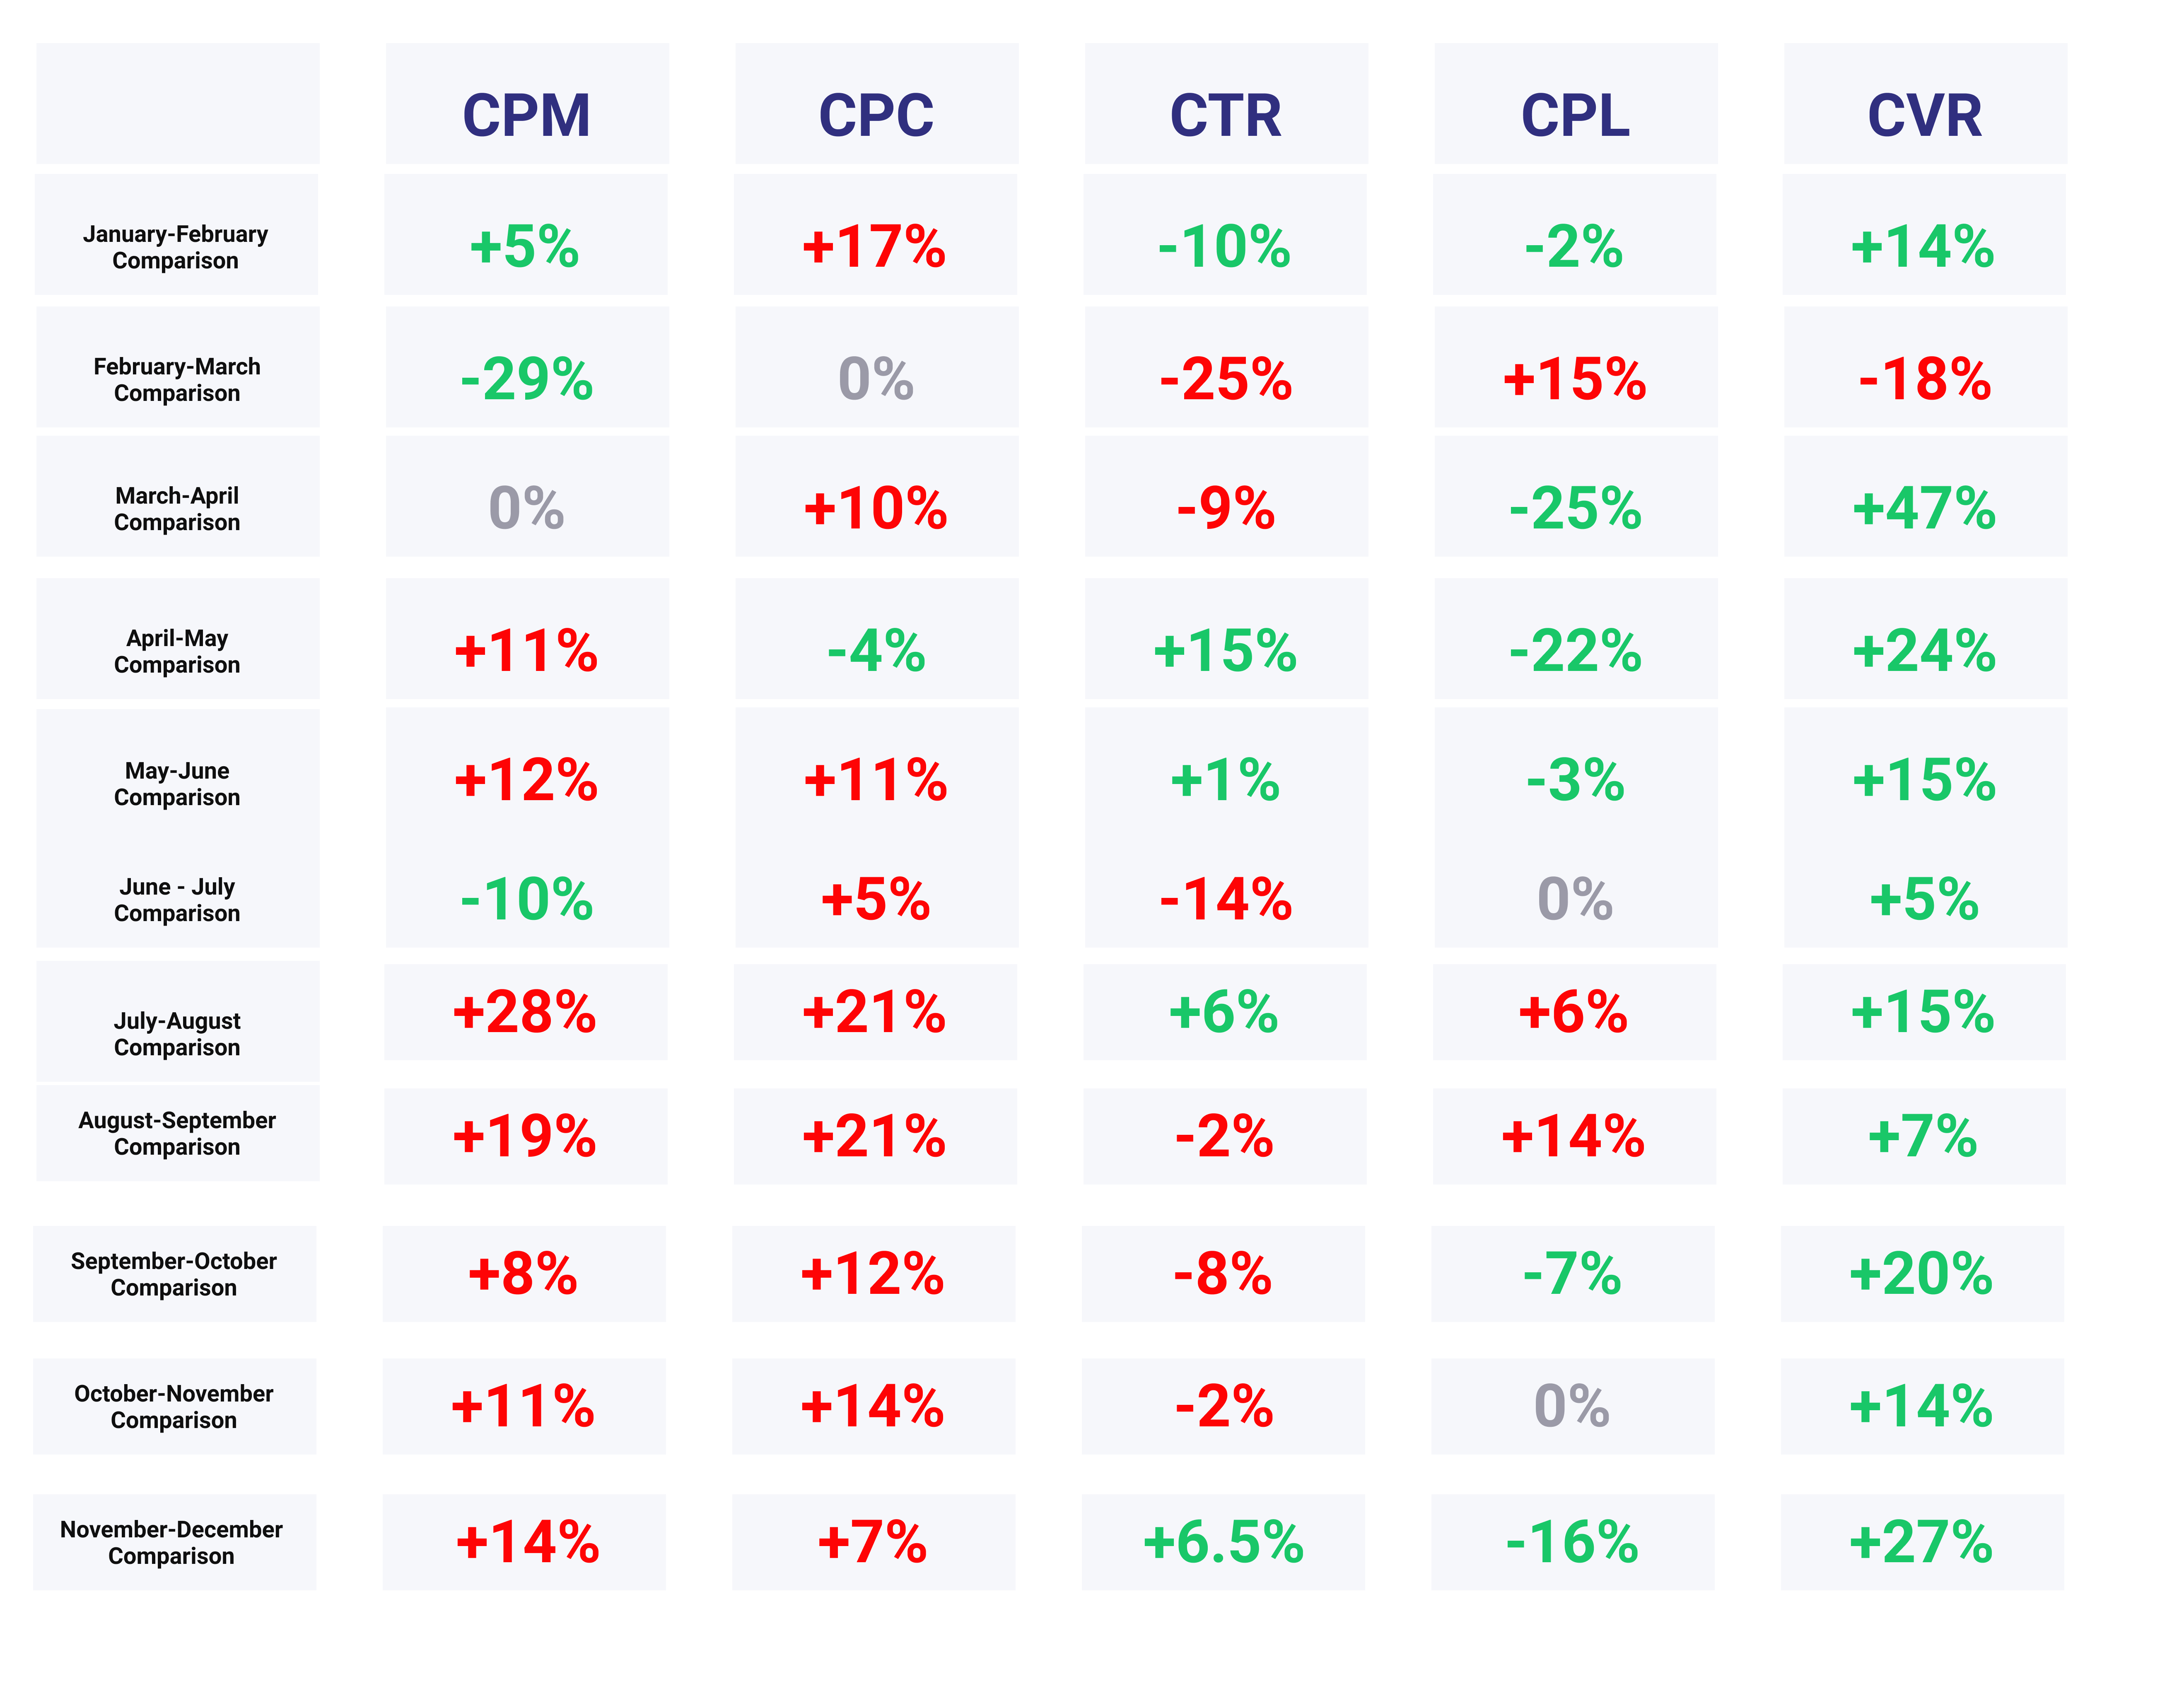
Looking at seasonality in Real Estate, December is typically a slower month for marketing efforts, with lower-than-average lead conversion rates signaling lower buyer intent. However, December 2020 continued to defy normal seasonality trends with an astonishing 27% increase in click-to-lead conversion rate (CVR), a 16% decrease in the Cost Per Lead (CPL), and the largest increase in Click Through Rate (CTR) that we recorded in a 6 month period.
Two factors that led to December’s high-performance numbers can also be used to summarize the overall uniqueness of 2020’s Real Estate Facebook Ads landscape.
The first factor: Low housing inventory rates lead to a sense of urgency for home buyers. When buyers scroll through their Facebook feed and see a new listing in a neighborhood with low inventory, they are highly incentivized to click and submit a lead form.
The second factor: Mortgage rates continue to be at an all time low. The average 30-year mortgage rate in December 2019 was 3.72% in December 2020 it was 2.68%. The decrease in mortgage rates creates more home buyers browsing a limited inventory of homes.
December experienced a third contributing factor that led to the unusually high CVR and low CPL, an increase in CTR. The 6.5% increase in CTR means that more people are clicking on ads to engage in home browsing behaviors.
Year-over-Year Seasonality Analysis
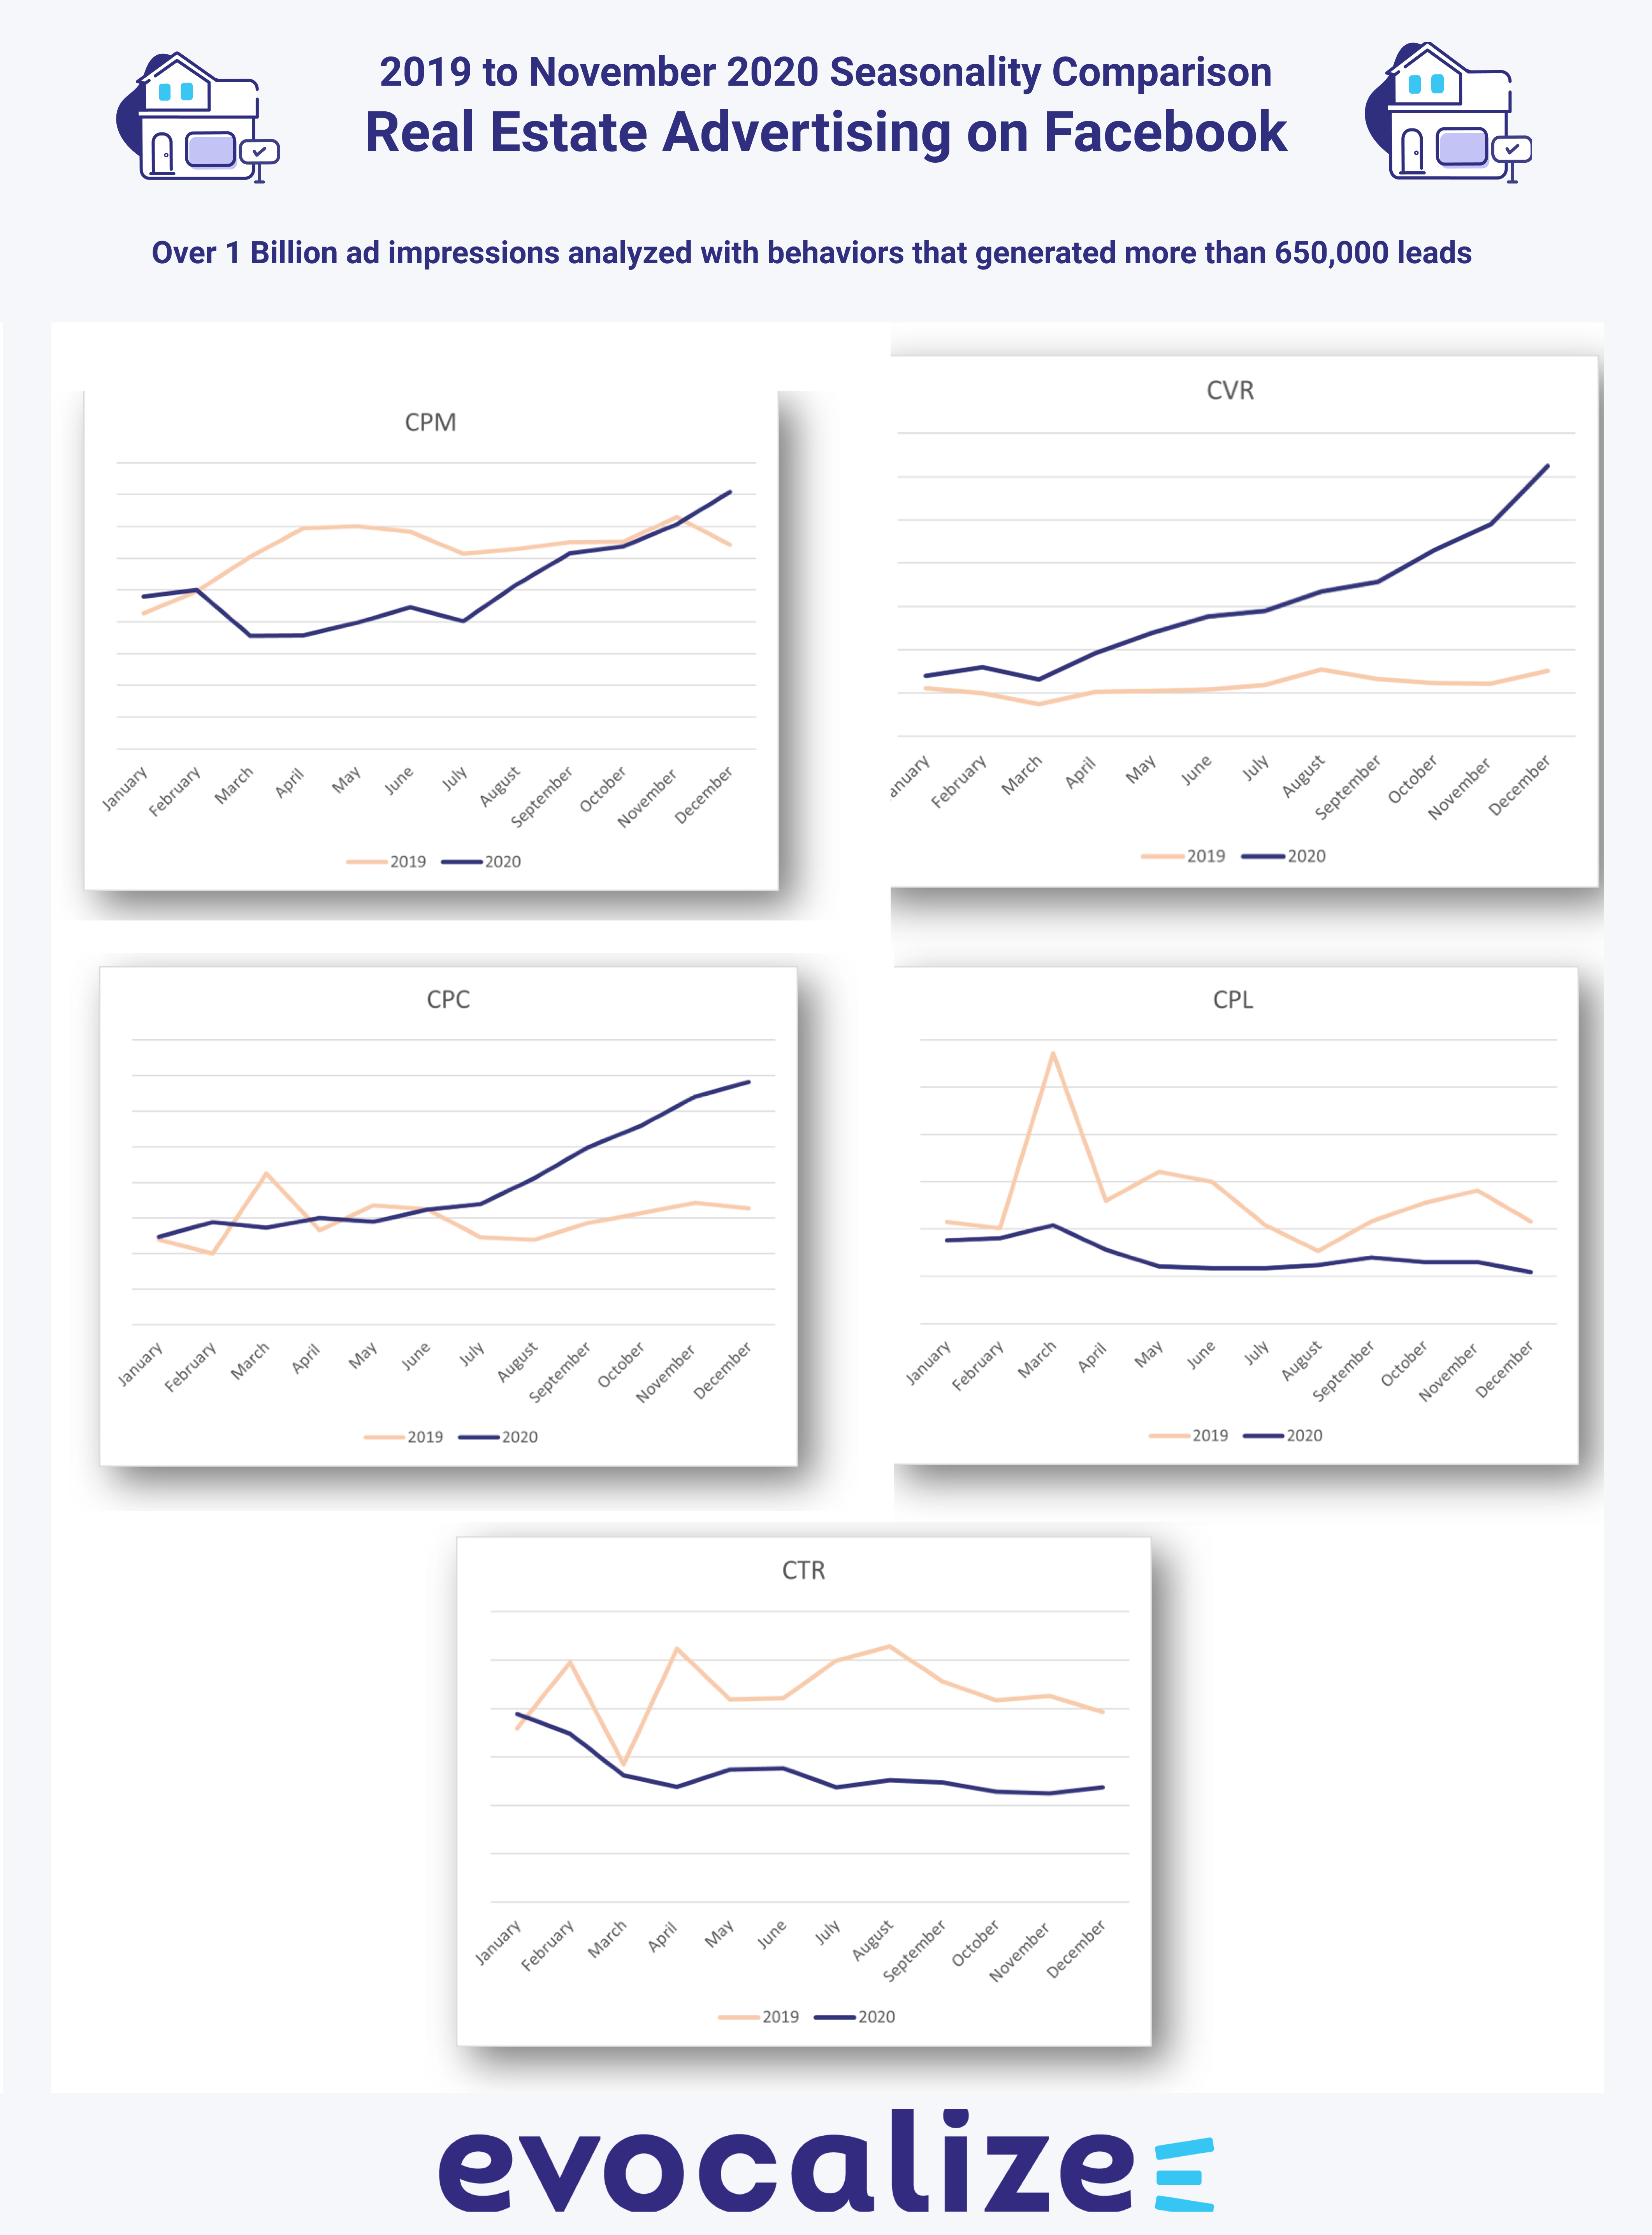
The above graphic shows year-over-year trend lines for CPM, CVR, CPC, CPL, and CTR.
The CPM chart shows the cost of media raising above 2019 levels for the first time since January 2020. In addition, across all charts the difference between 2019 and 2020 can be clearly seen.
Facebook Lead Ad Correlations
To understand if lead conversion rate on Facebook can be an early indicator of customer demand in the Real Estate Industry, we are tracking the National Association of REALTOR’s Pending Home Sales Index and Existing Home Sales. Below, these metrics are displayed next to Facebook’s Lead Conversion Rate (CVR).
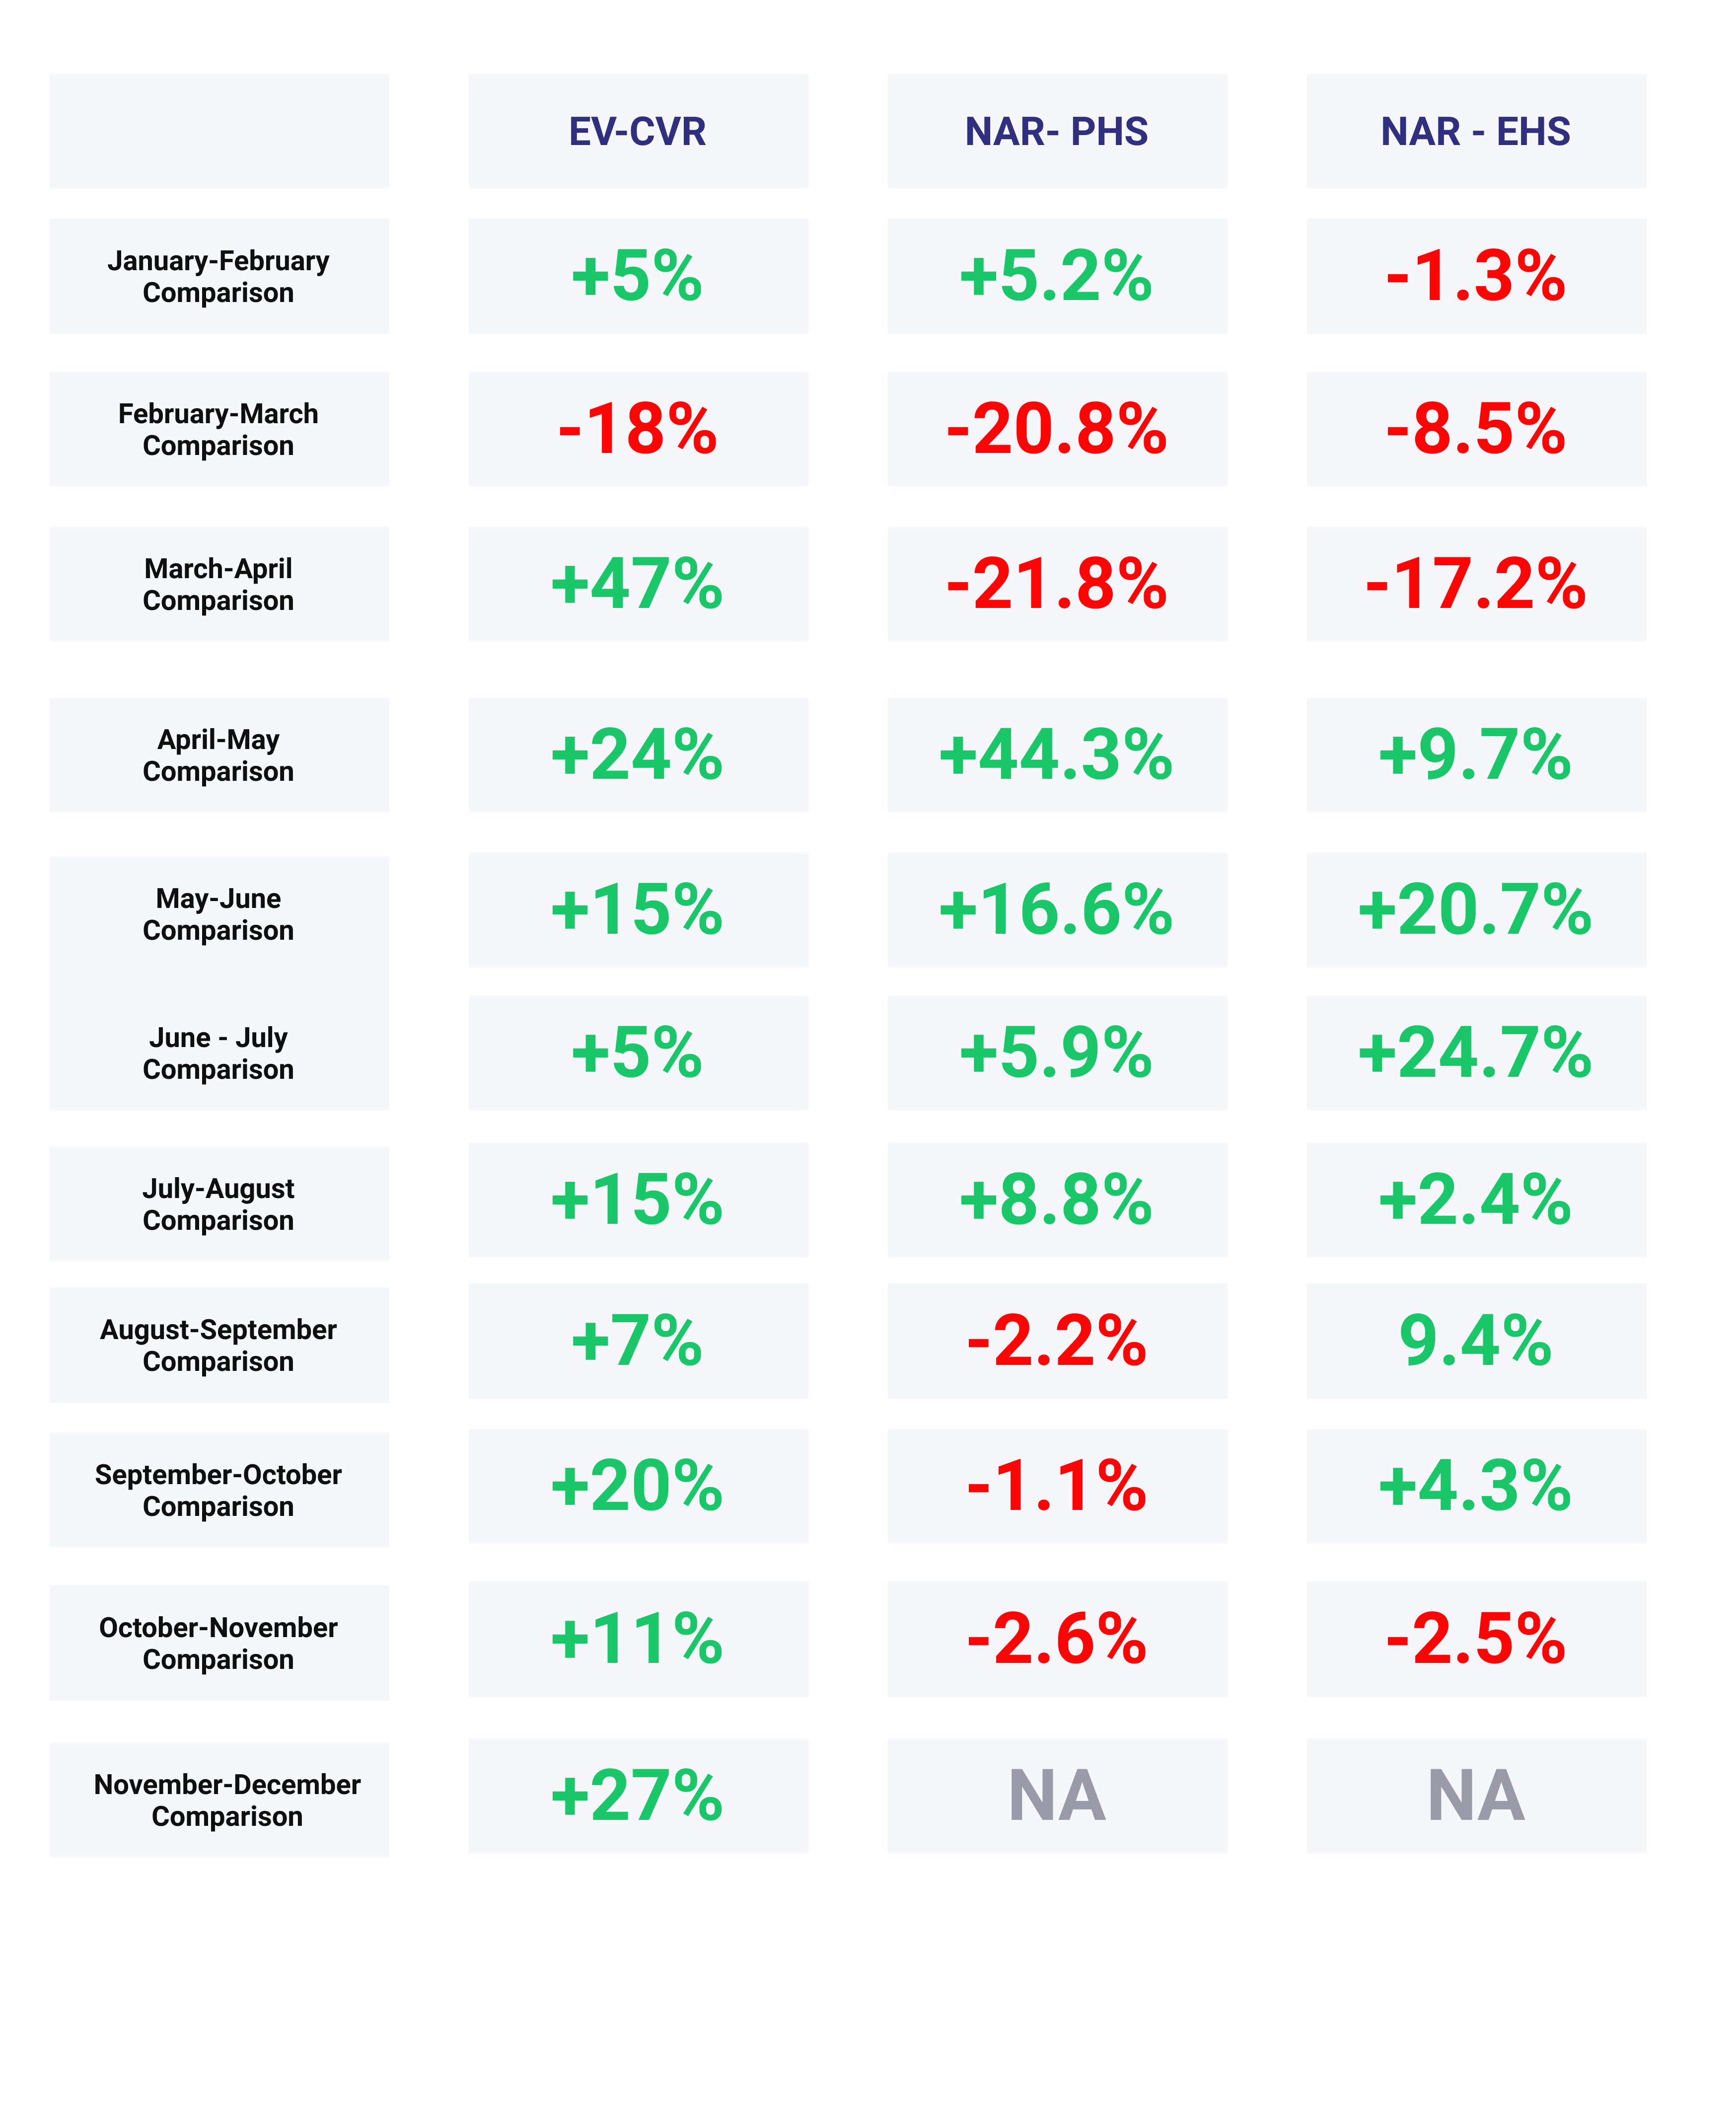
Summary
Facebook Advertising in 2020 continued to defy 2019’s seasonality trends. This is showcased by an extraordinary 27% increase in CVR and a 17% decrease in CPL. These strong signals don’t show any sign of lightening up, making Facebook advertising an important marketing channel for brokers and agents to invest in early 2021 to generate leads and awareness for their businesses.
Our team will publish our next analysis in April 2021 that reviews insights from Real Estate advertising on Facebook from Q1 2021.
Share
Subscribe to our blog
Don’t miss a beat in the fast-changing local digital marketing landscape — sign up to stay ahead of the curve!


