Industry Report: Real estate advertising on Facebook November 2020 issue
Share
Schedule a 30-min marketing strategy call with our team
Our Real Estate Advertising on Facebook Industry Report continues to provide insights that agents and brokers will find valuable as they assess end-of-year strategies. The below analysis includes data from over 1 Billion ad impressions, behaviors that have generated over 650,000 leads, and metrics from the National Association of REALTORs.
2020 Month-over-Month Comparison

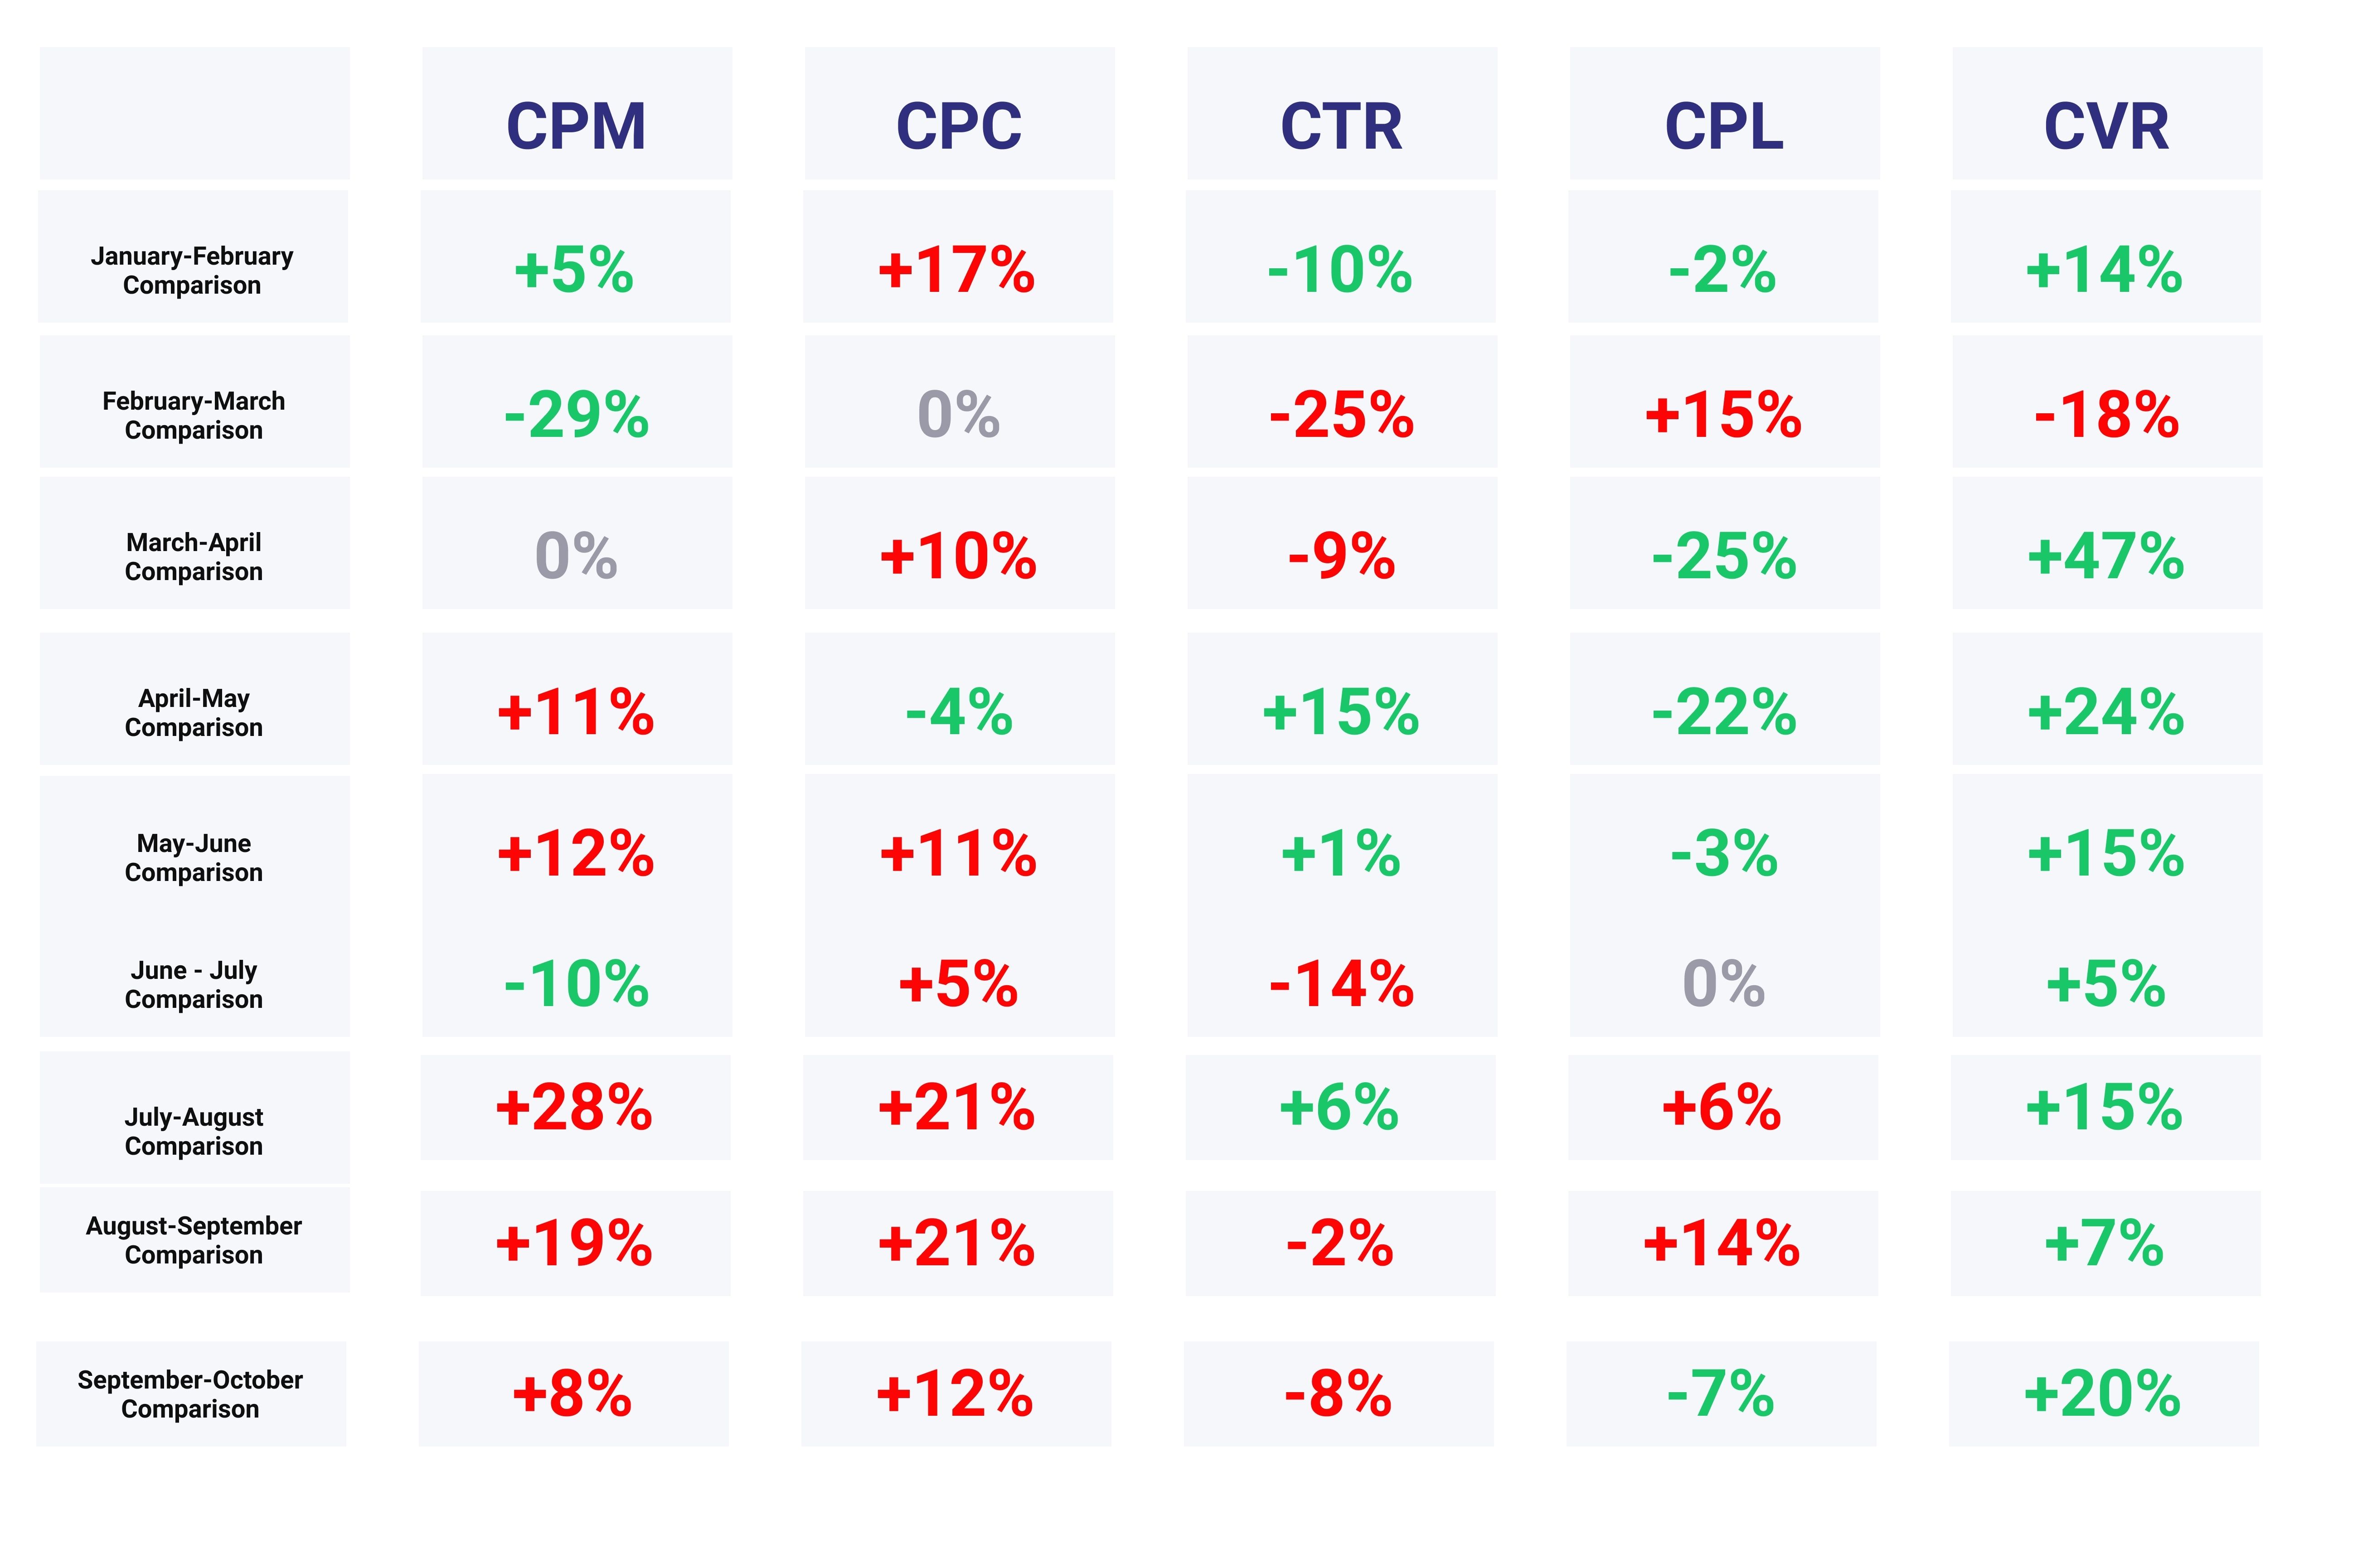
Comparing month-over-month data from September and October we recorded an unexpected 20% increase in lead conversion rate (CVR). In our last analysis, we recorded an increase in CVR, however, it was a smaller increase from the previous month. This may have started to signal the normal seasonality decrease in intent. But, this report’s 20% increase busts this theory and still shows strong buyer and seller intent.
The Cost of Media (CPM – Cost per 1,000 ad impressions) increased by 8%. We believe the main two drivers of this increase are an increase in advertiser demand due to the upcoming holiday season and the 2020 US Presidential Election. This increase in CPM coupled with the 8% decrease in Click Through Rate (CTR- measurement of the percent of people who see an ad and click on it) leads to a 12% increase in the cost per click (CPC).
The abnormally high increase in CVR balanced out the rising media costs to produce a 7% decline in the cost per lead (CPL).
As we head into the final two months of the year, agents and brokers who continue their Facebook Advertising programs should continue to produce amazing results.
Year-over-Year Seasonality Analysis

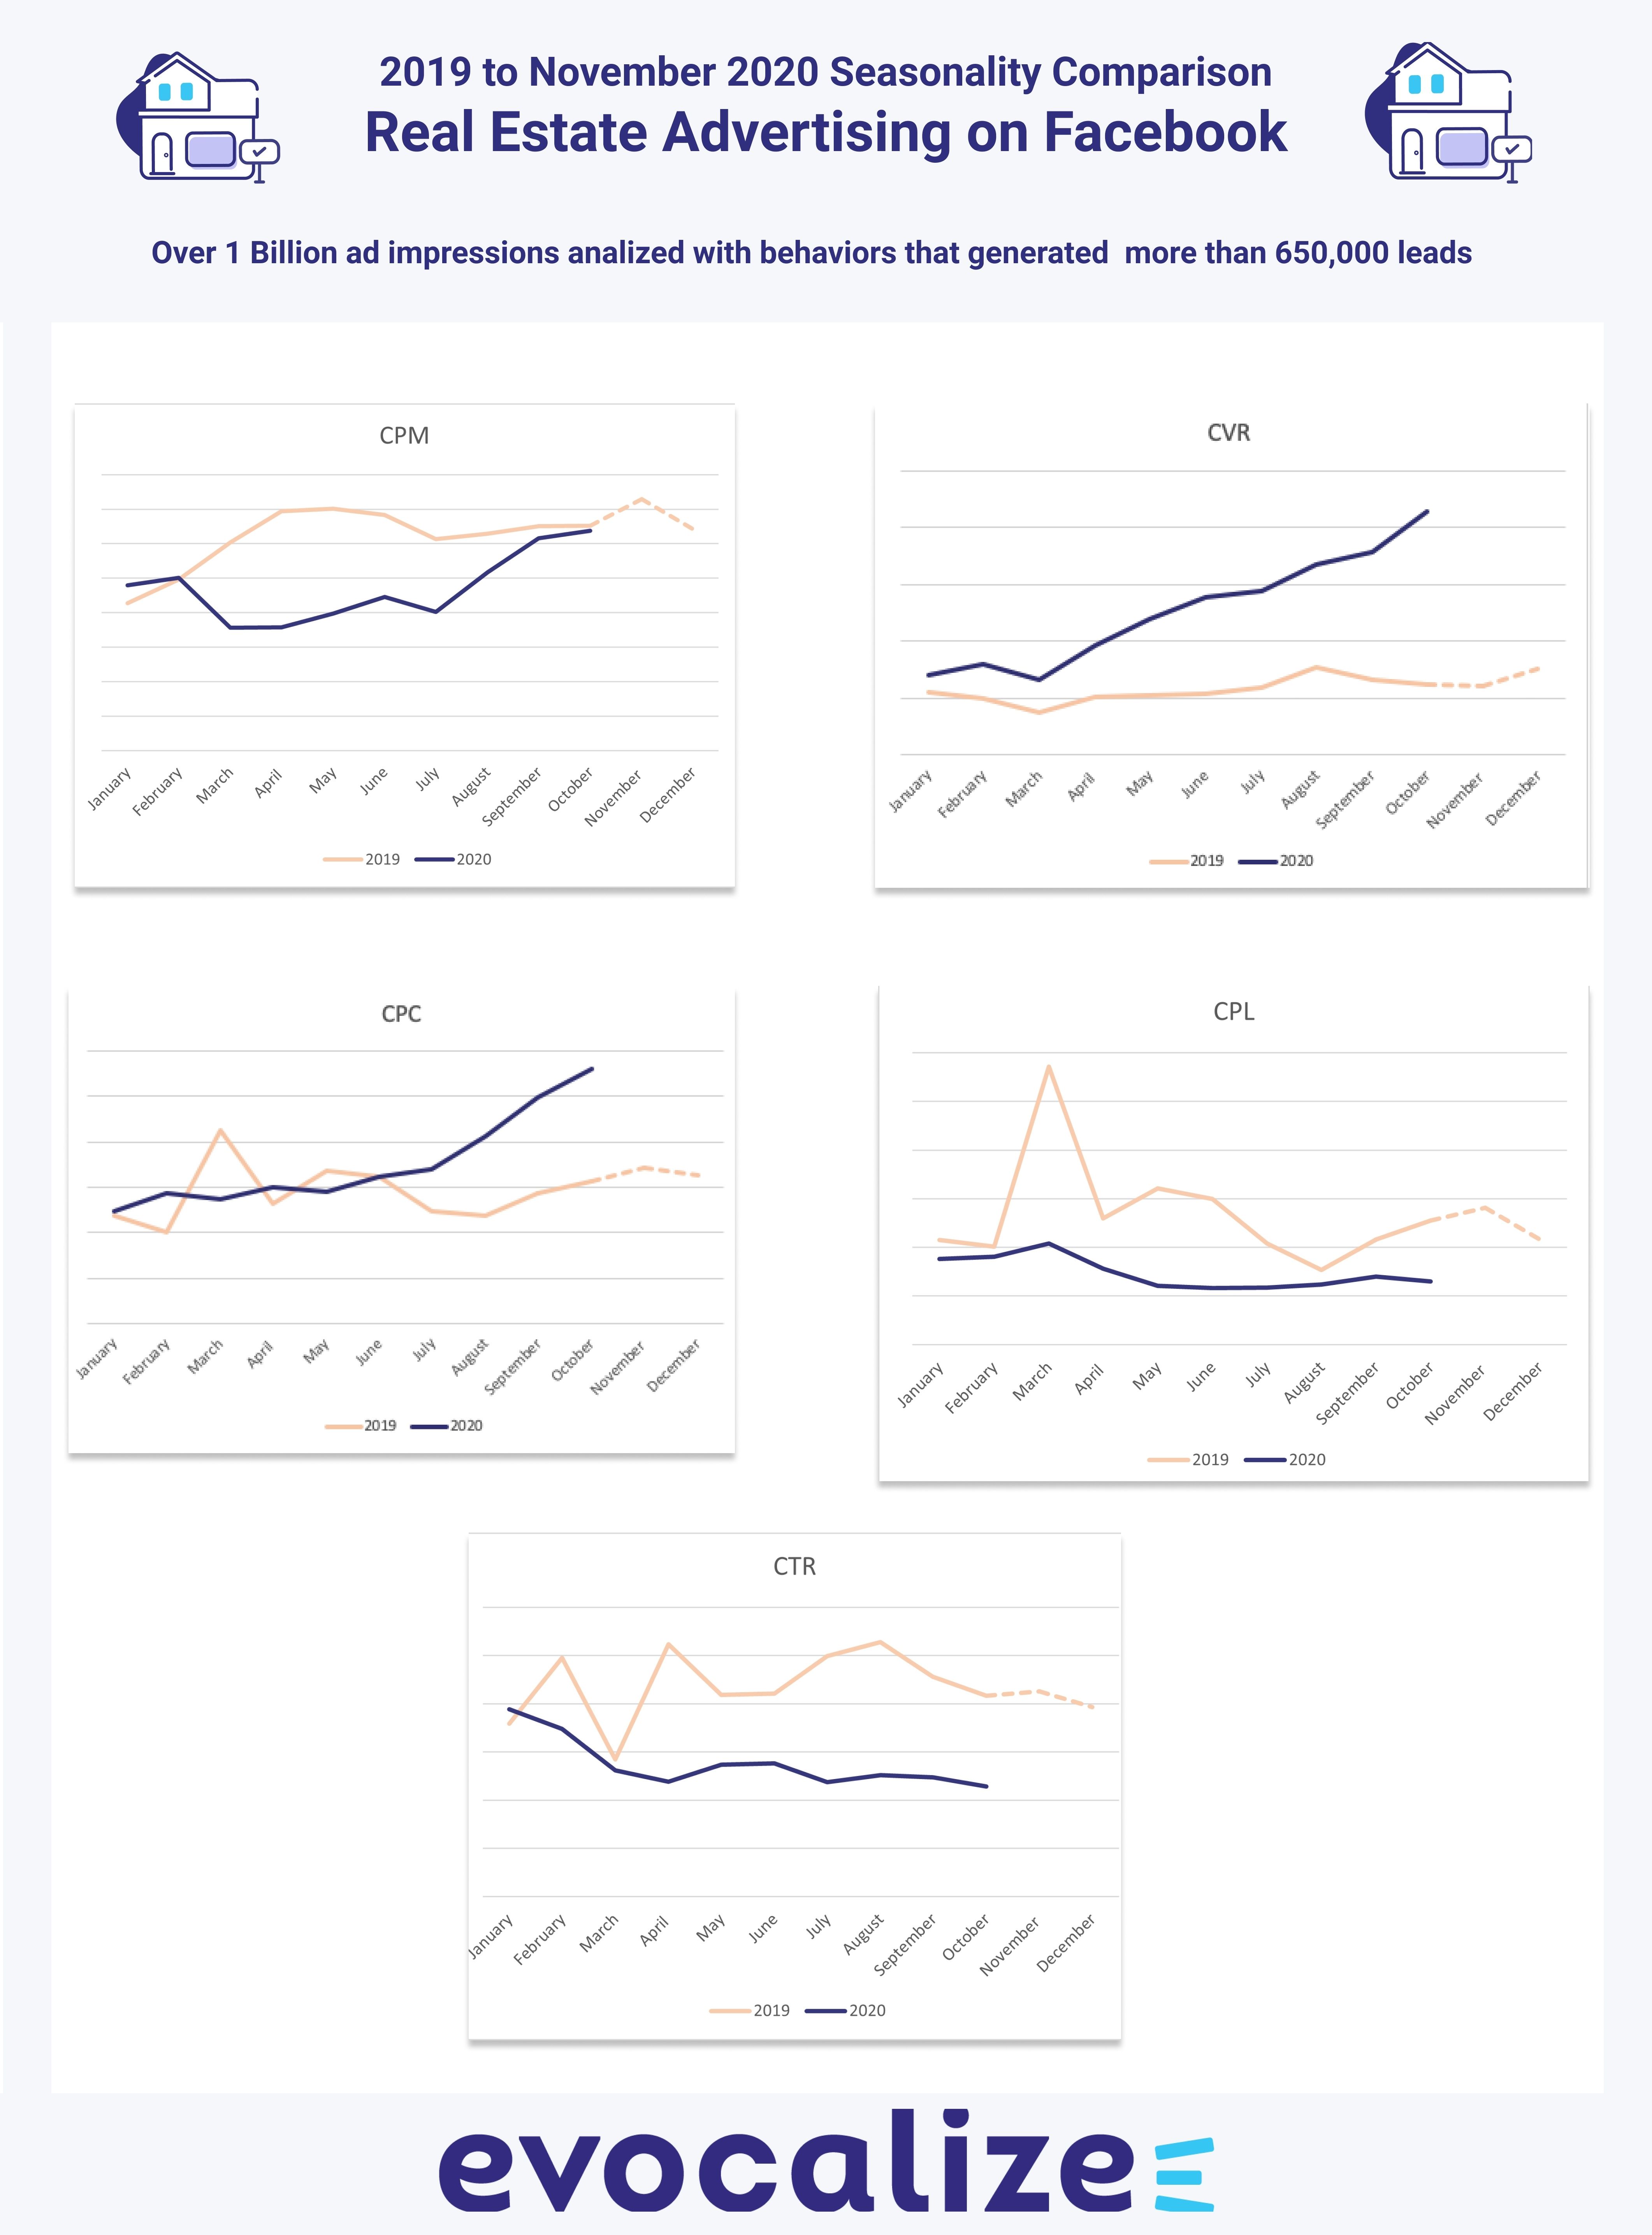
Represented in the above image are five line charts that compare year-over-year metrics for CPM, CVR, CPC. CPL and CTR.
This YoY view shows the significant differences between last year’s Facebook advertising metrics during a normal real estate annual cycle, and this year’s metrics that are impacted by COVID-19. This also shows how seasonality was trending in 2019 as we moved into winter.
Facebook Lead Ad Correlations
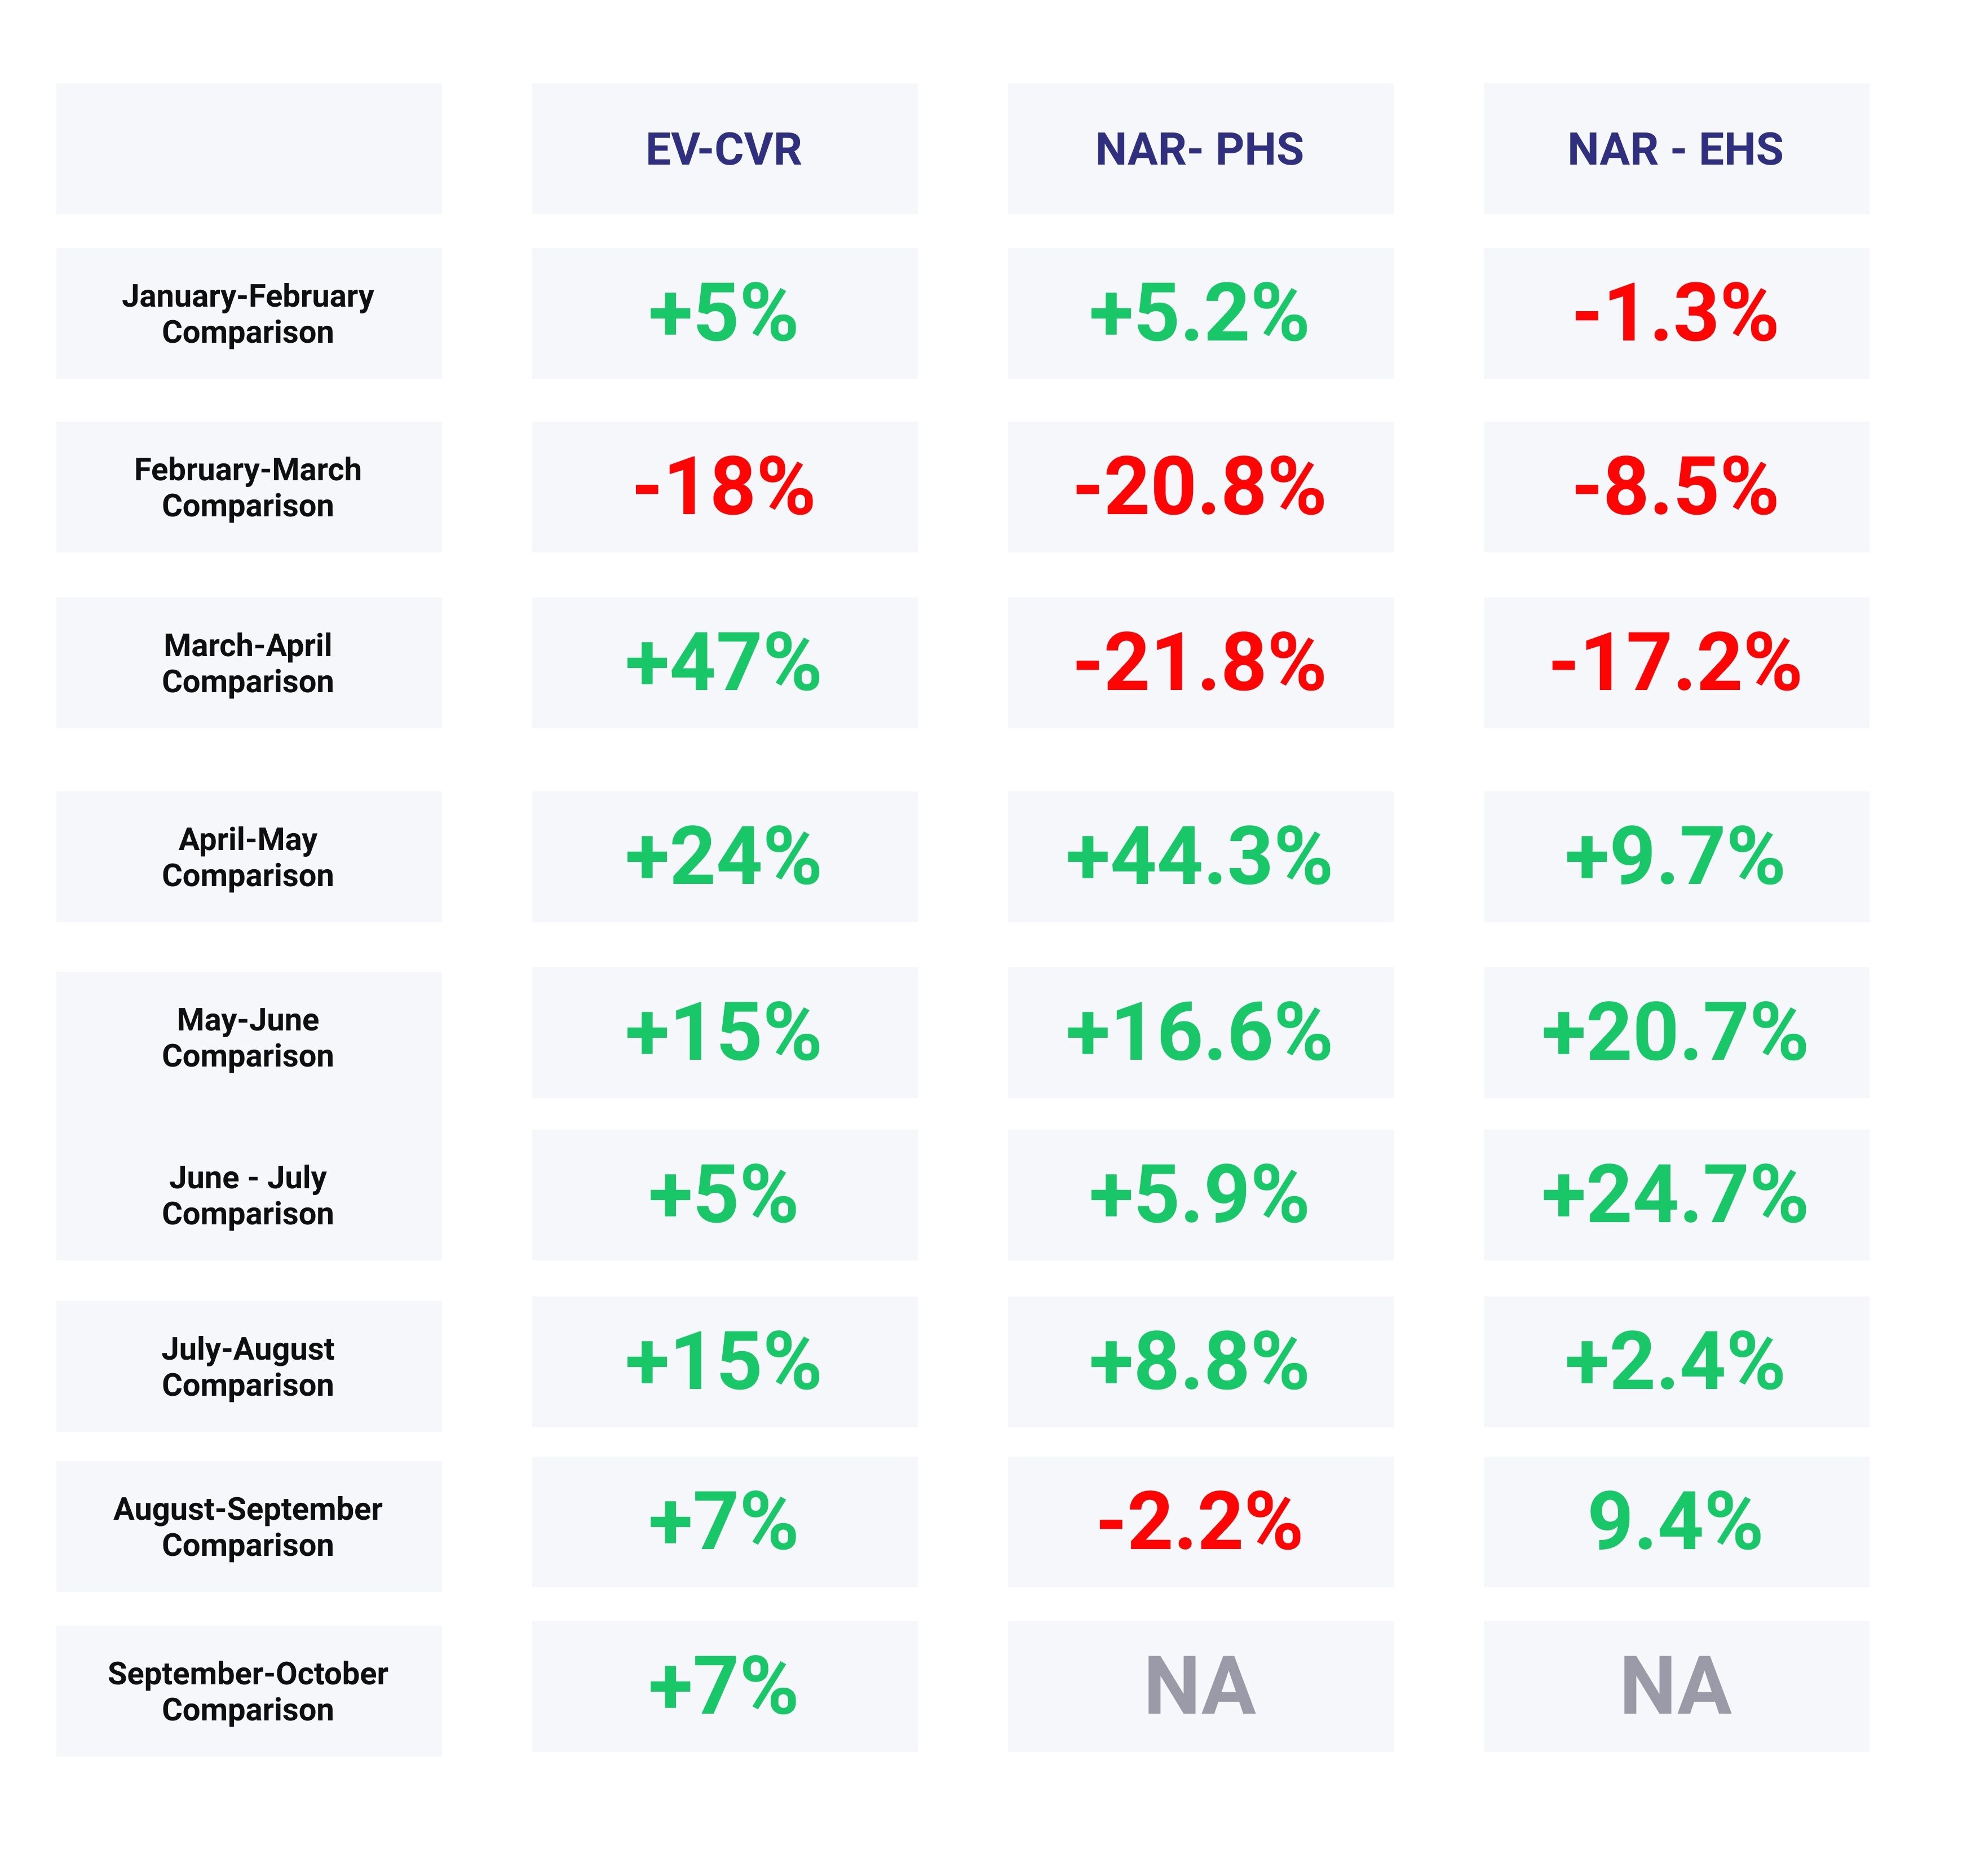
To understand if lead conversion rate on Facebook can be an early indicator of customer demand in the Real Estate Industry, we are tracking the National Association of REALTOR’s Pending Home Sales Index and Existing Home Sales. Below, these metrics are displayed next to Facebook’s Lead Conversion Rate (CVR).

Summary
The year continues to defy traditional seasonality trends in Real Estate Advertising on Facebook, as showcased by the 20% month-over-month increase in CVR by 20%. As media costs start to rise due to the upcoming holiday season, the CPL in real estate advertising continues to fall due to strong buyer and seller intent.
As we head into the last two months of the year, Facebook Advertising continues to be a dominant lead generation channel for real estate agents and brokers.
Share
Subscribe to our blog
Don’t miss a beat in the fast-changing local digital marketing landscape — sign up to stay ahead of the curve!


