Industry Report: Real estate advertising on Facebook, October 2020
Share
Schedule a 30-min marketing strategy call with our team
We have transitioned our monthly COVID-19 Impact Report towards a broader analysis focused on delivering insight for real estate advertising on Facebook. Our expanded data set from a subset of our real estate business now covers a 21-month span and includes over 1 billion ad impressions and online behaviors that generated more than 650,000 leads. Let’s dive in on real estate advertising on Facebook!
2020 Month-over-Month Comparison Analysis

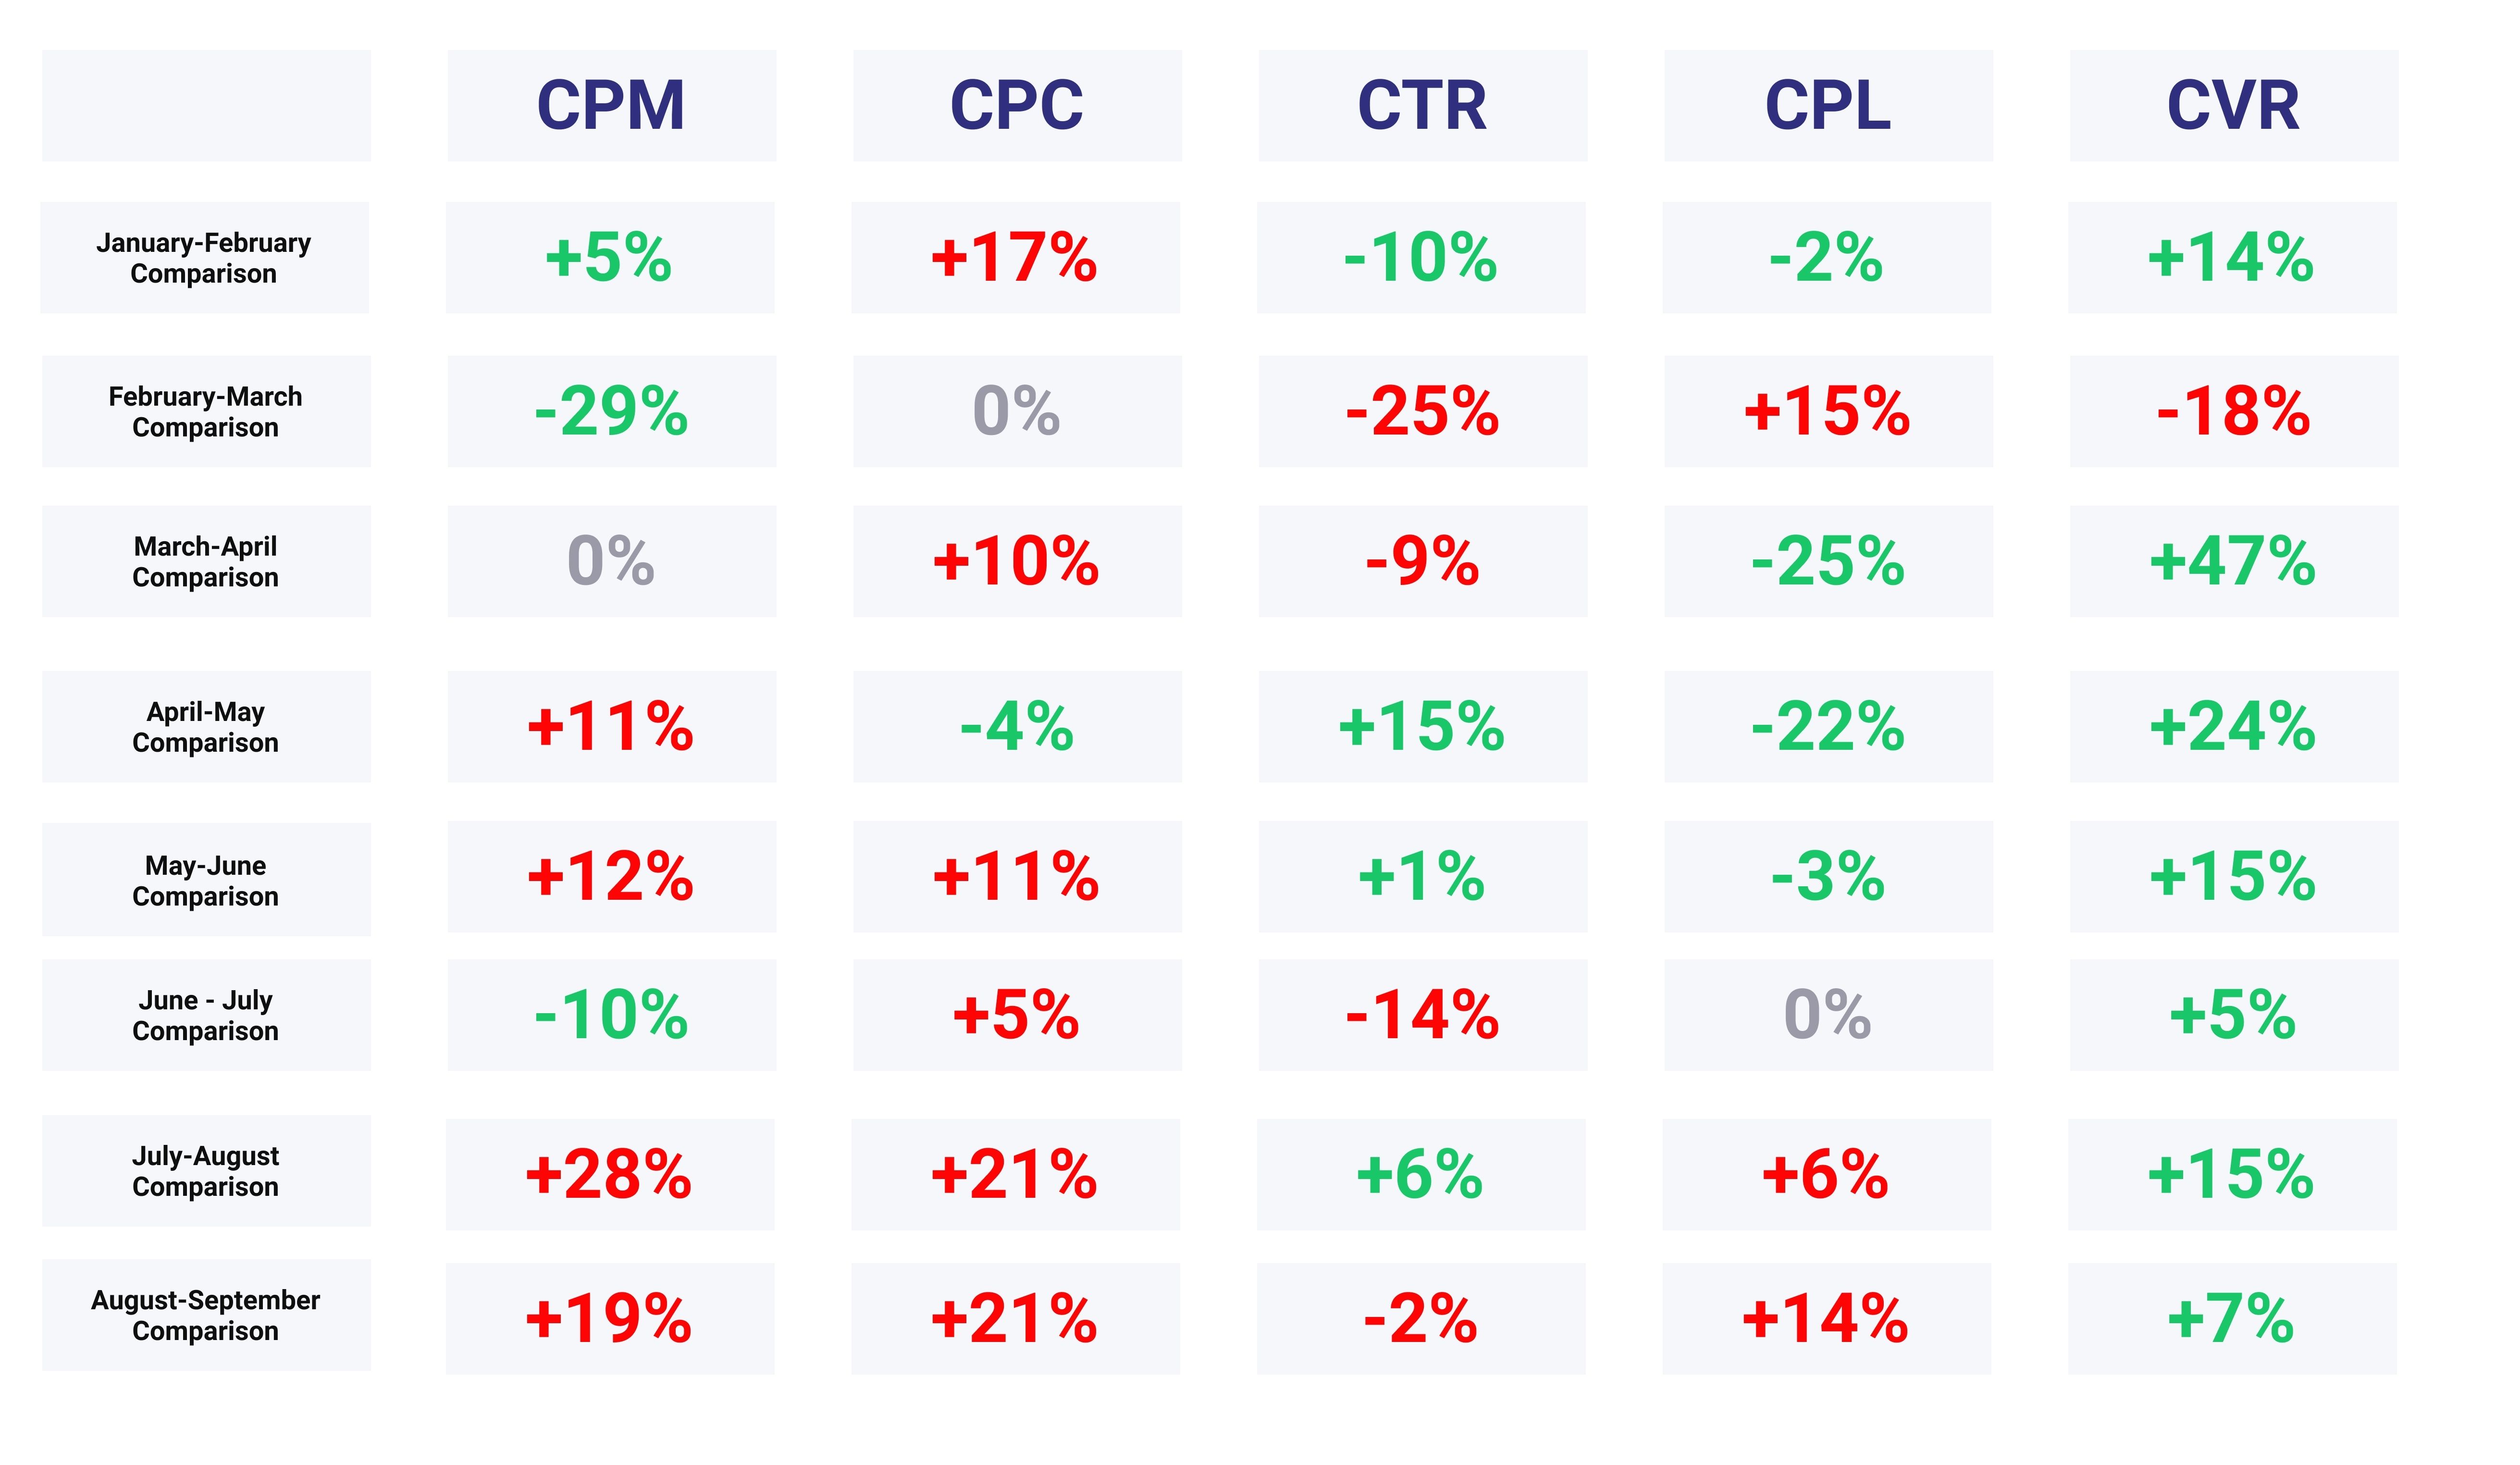
As we enter Fall, we see Lead Conversion Rate (CVR) continue to rise signaling a strong amount of buyer and seller intent.
We believe that the rising Cost of Media (CPM) was heavily influenced by three factors: advertisers spending more to achieve end-of-quarter goals, industries impacted by COVID-19 are starting to return, and a heavy influx of political ads.
The rising cost of media coupled with decreasing Click Through Rate (CTR) led to an increase in the Cost Per Lead (CPL) and the Cost Per Click (CPC).
For real estate advertising on Facebook, we recorded a lower amount of people clicking on the ads, but the people who are clicking still show strong intent to buy or sell a home.
Month-over-Month Seasonality Analysis

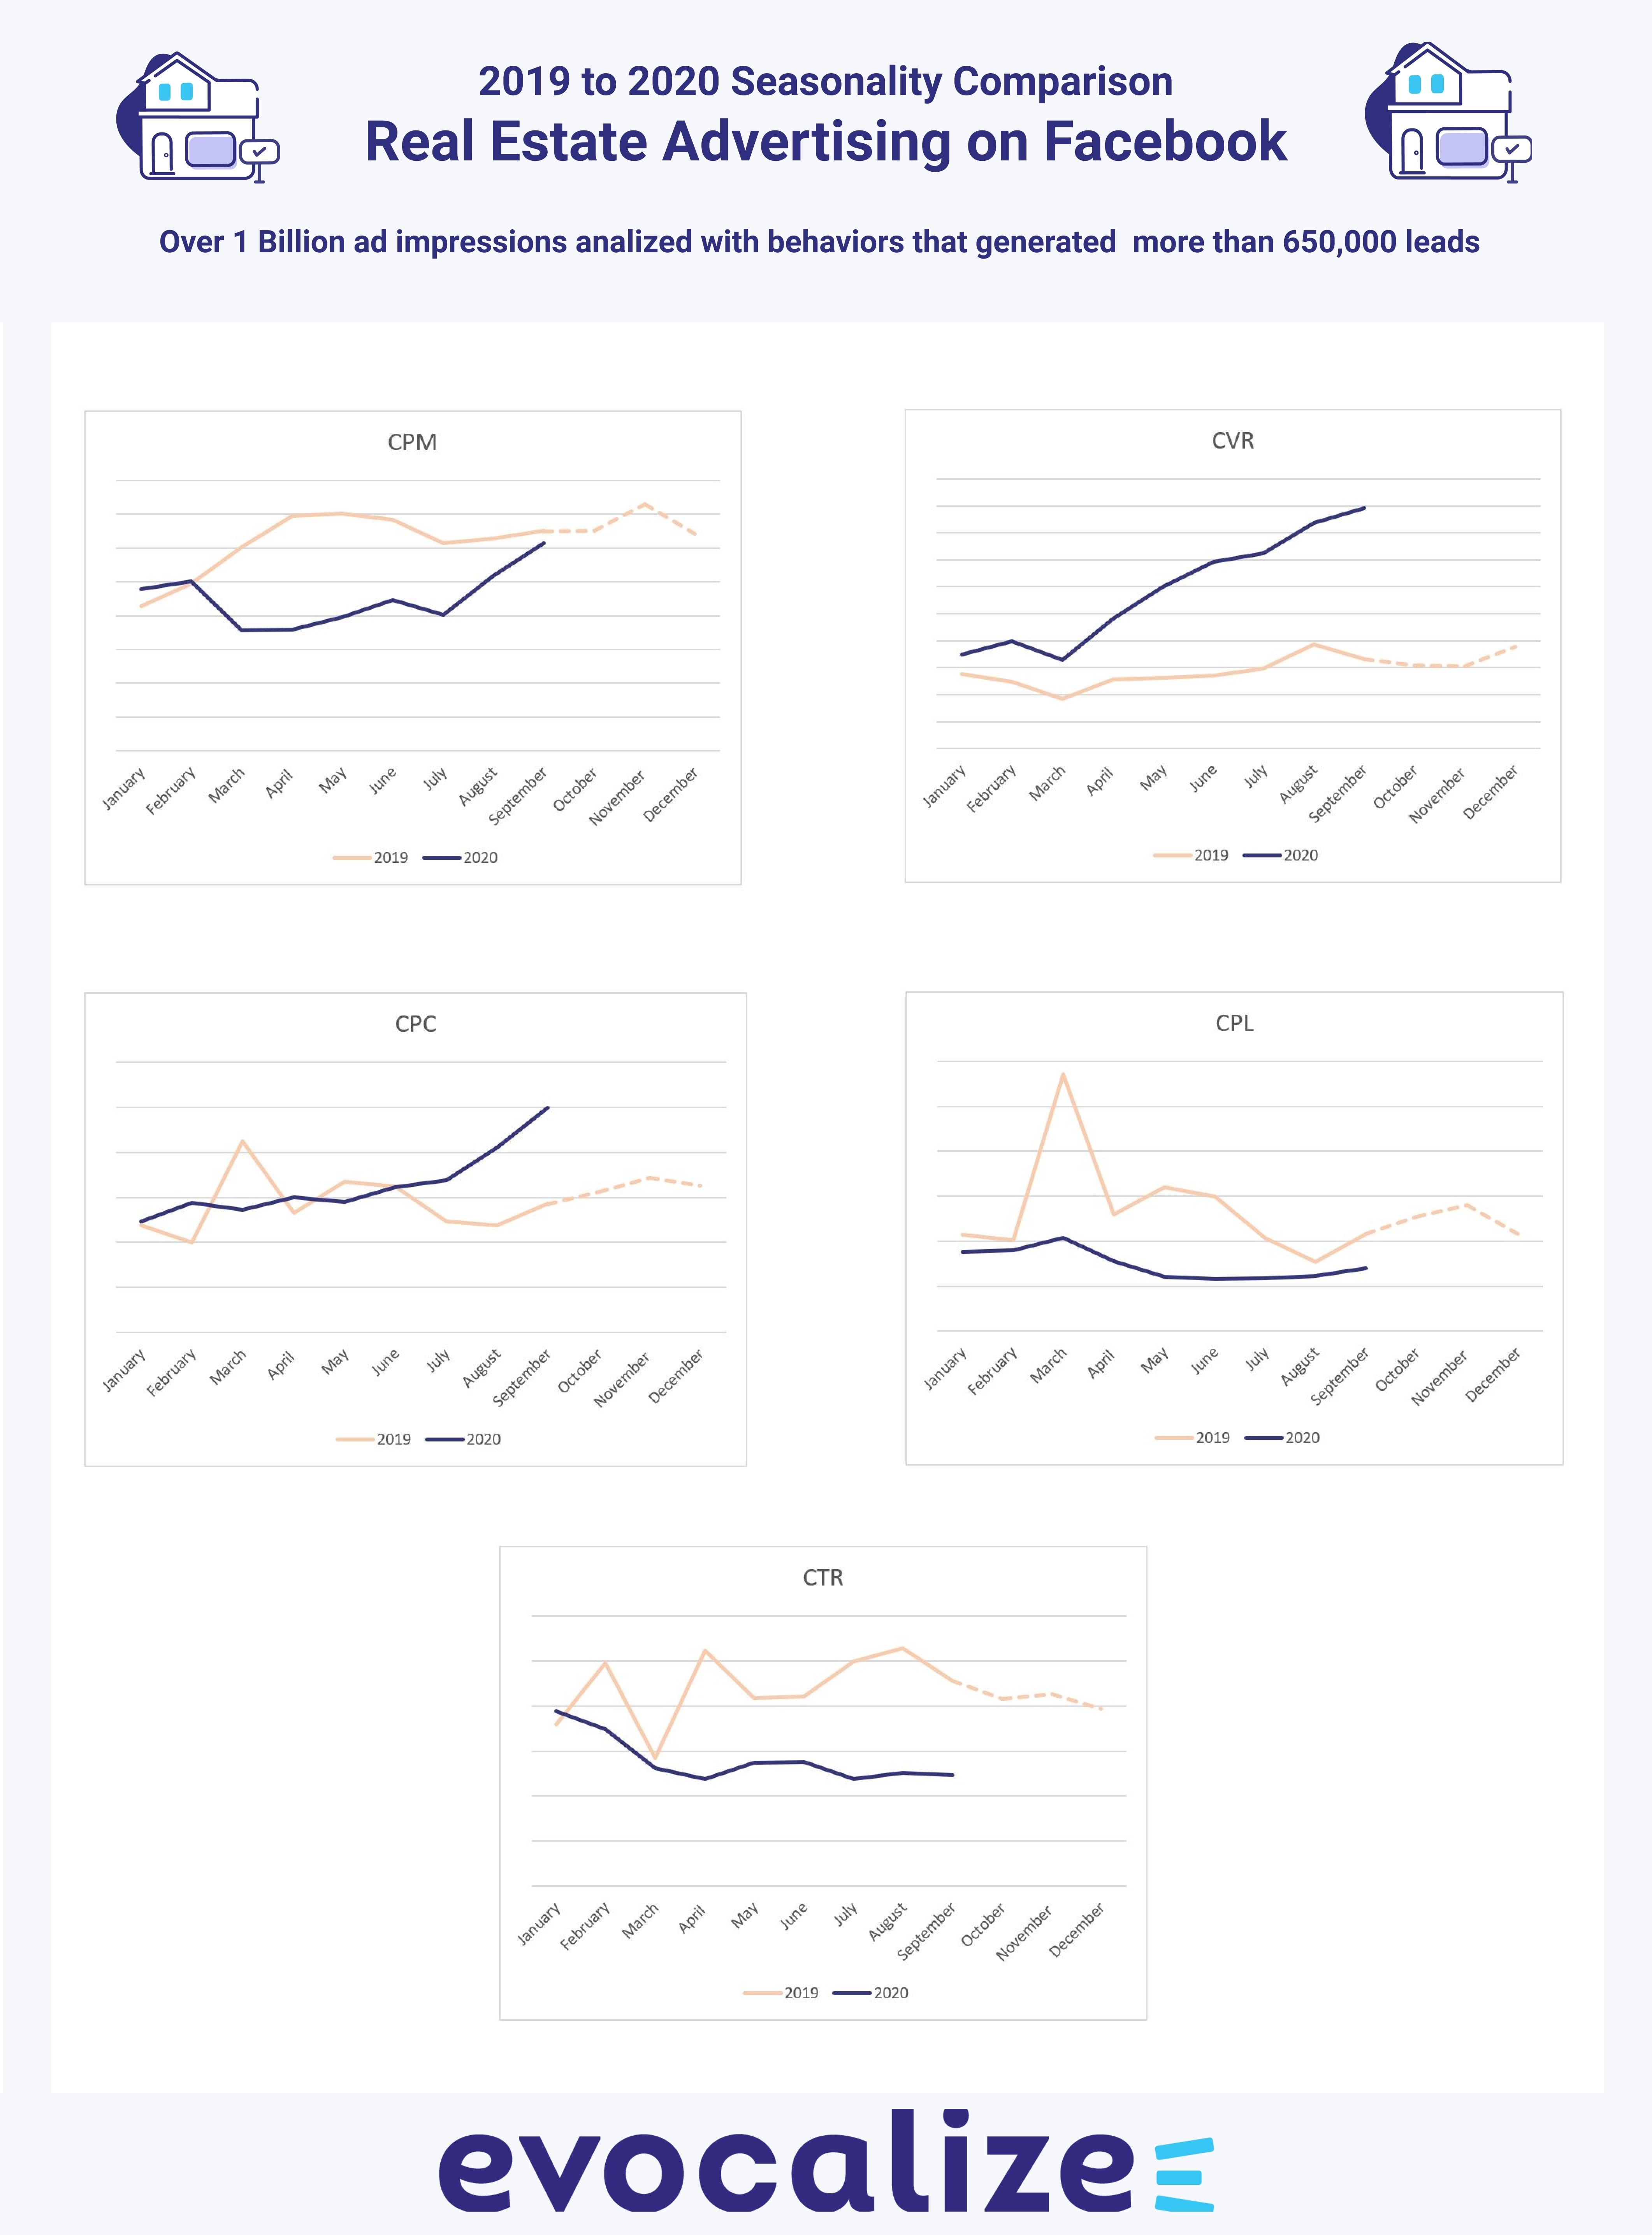
Comparing 2019 data to 2020 data from the same month-over-month comparison shows COVID-19’s impact on the current Real Estate market and suggests that buyer and seller intent will continue into the Fall months.
The most significant difference we are seeing year-over-year is the 7% increase in 2020 Lead Conversion Rate (CVR) compared to the 15% decrease in 2019. By this time last year, intent was decreasing in signals across the board while this year, we are continuing to see intent signals such as CVR increase. Also, the 2020 1.8% decrease in Click Through Rate (CTR) compared to the 13% decrease in 2019 shows the audience of buyers and sellers continues to display listing browser behavior.
Year-over-Year Seasonality Analysis

Represented in the above image are five line charts that compare year-over-year metrics for CPM, CVR, CPC, CPL, and CTR.
This YoY view shows the significant differences between last year’s Facebook advertising metrics during a normal real estate annual cycle, and this year’s metrics that are impacted by COVID-19. This also shows how seasonality was trending in 2019 as we moved into winter.
Facebook Lead Conversion Correlation
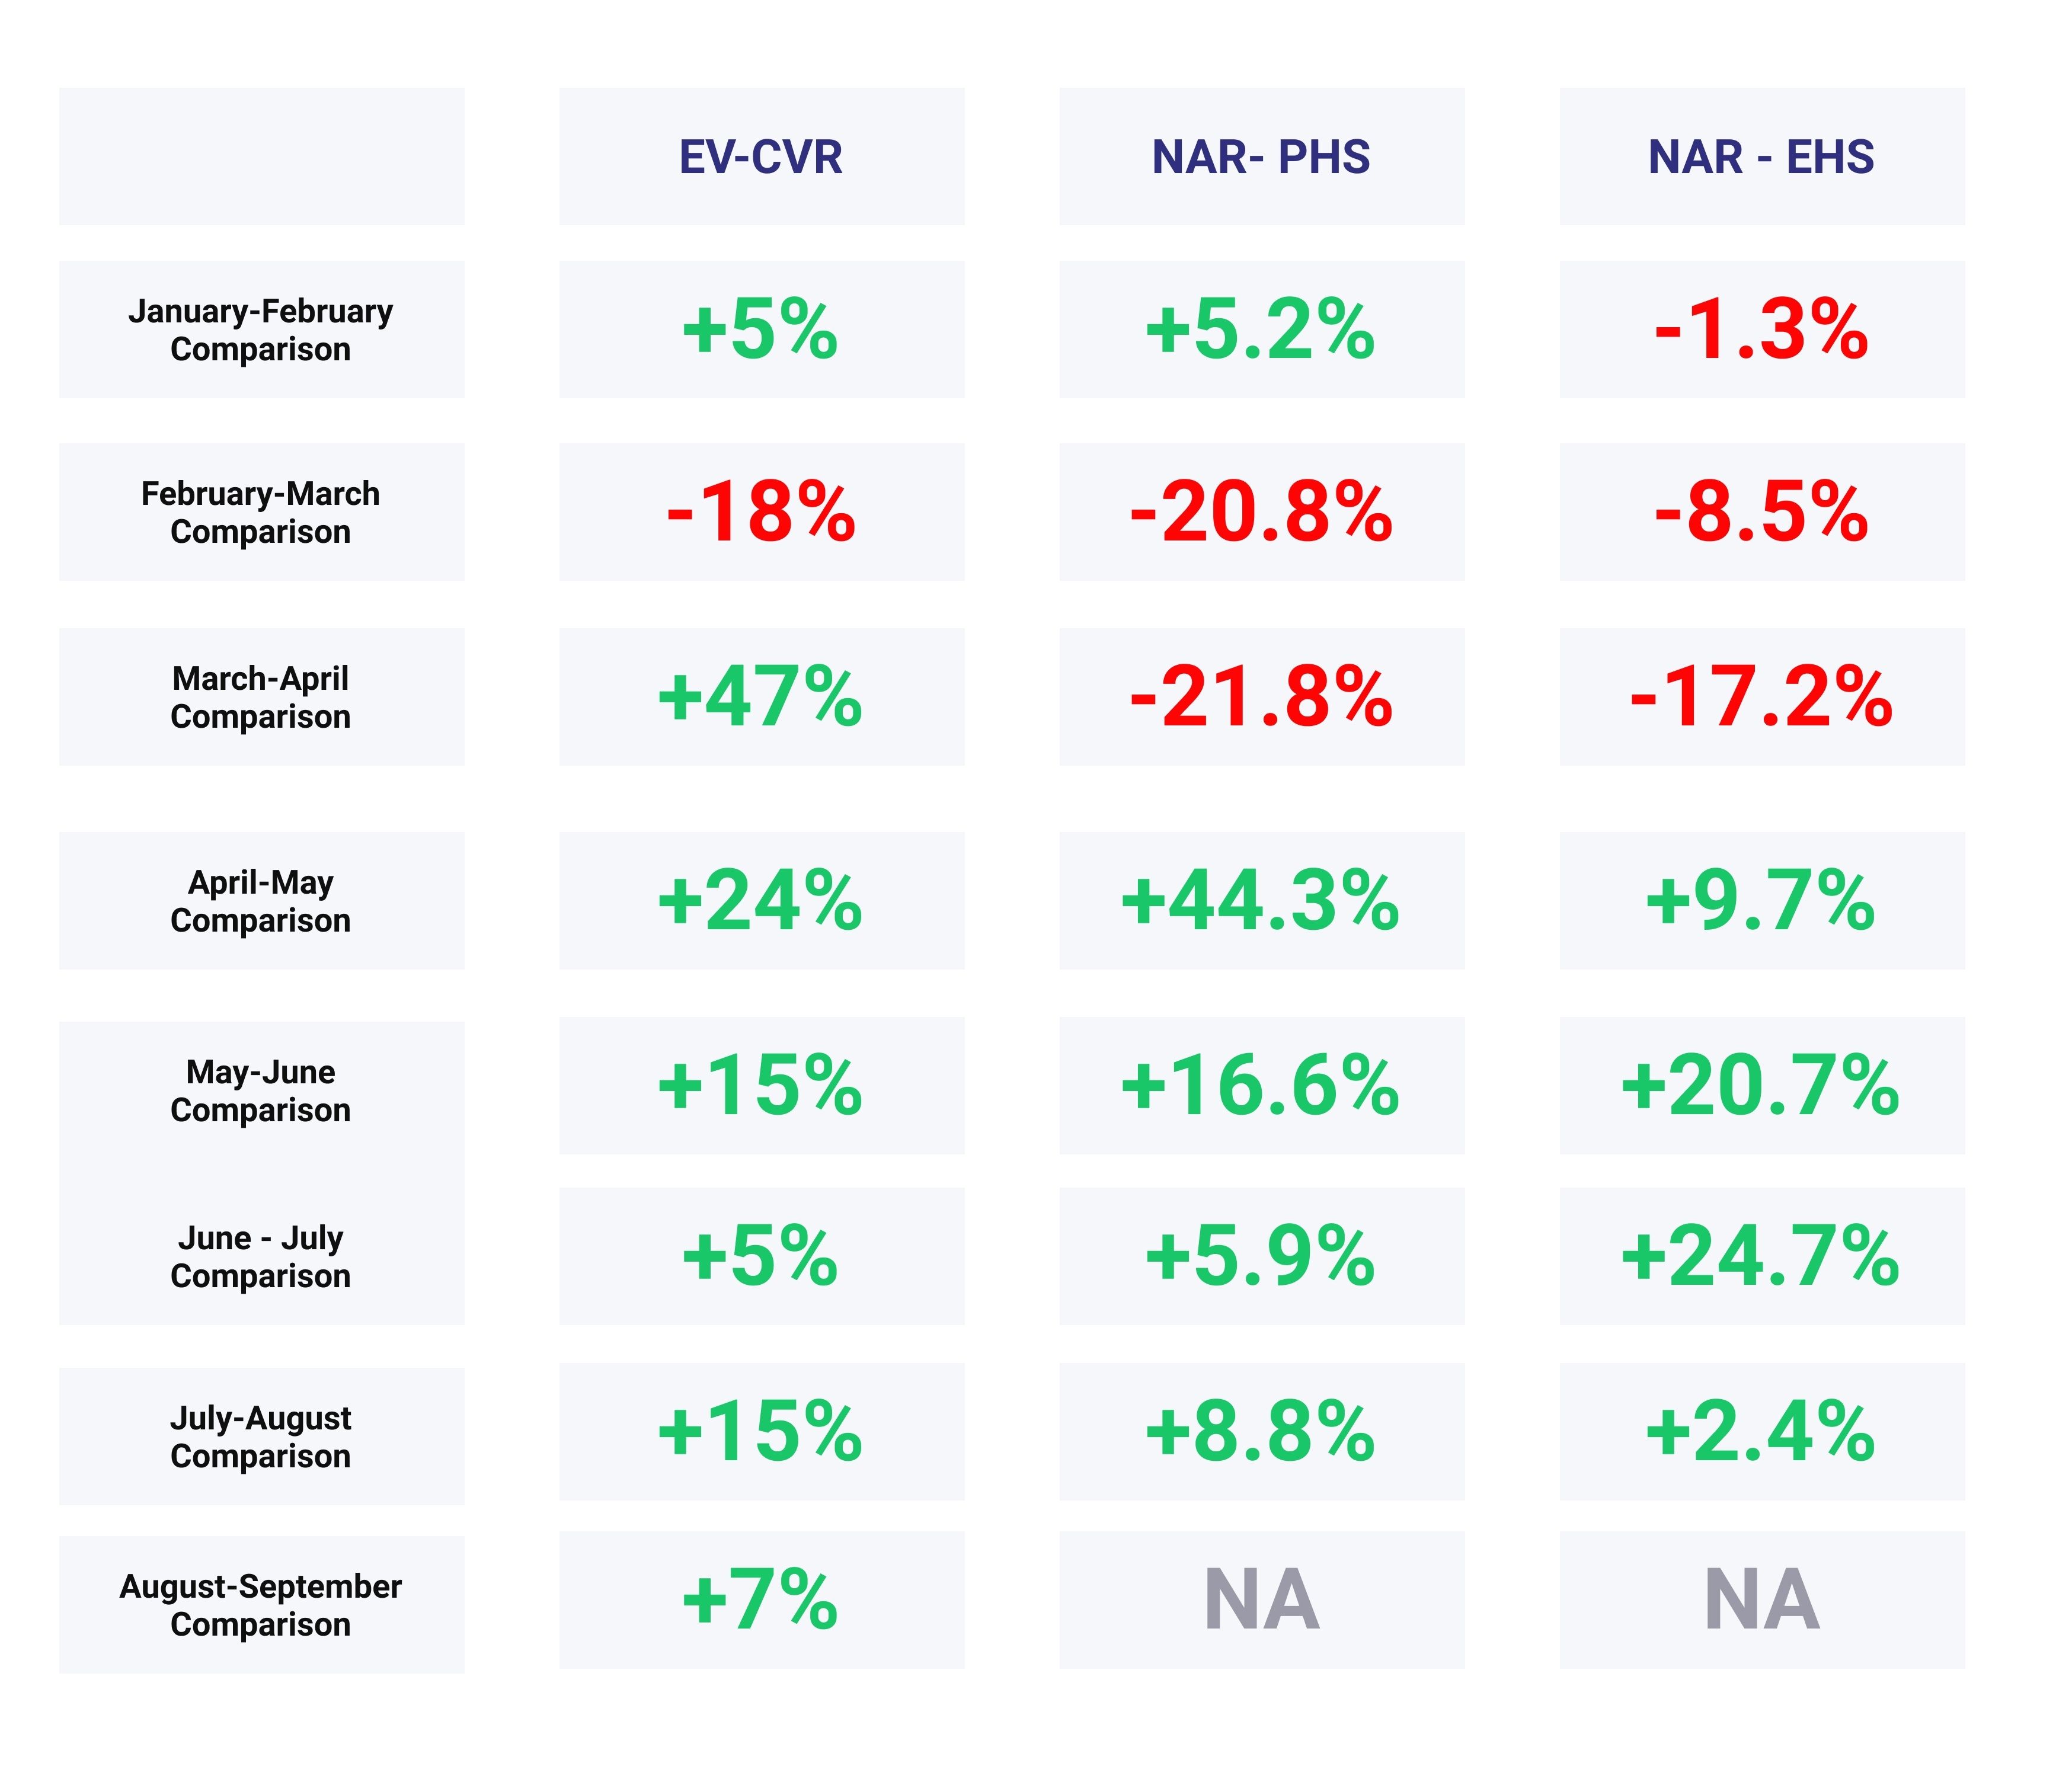
To understand if lead conversion rate on real estate advertising on Facebook can be an early indicator of customer demand in the Real Estate Industry, we are tracking the National Association of REALTOR’s Pending Home Sales Index and Existing Home Sales. Below, these metrics are displayed next to Facebook’s Lead Conversion Rate (CVR).

Summary of real estate advertising on Facebook
In September we did not see the normal decline in Lead Conversion Rate and Click Through Rate that normally marks entry into the slower Fall real estate season. This is signaling that buyer and seller intent is still strong. Though cost per lead is beginning to increase due to COVID-19 effects and an influx of advertiser demand due to the election season and end-of-quarter spend increases, the opportunity to capitalize on an extended buying season is still strong.
Share
Subscribe to our blog
Don’t miss a beat in the fast-changing local digital marketing landscape — sign up to stay ahead of the curve!


