
June update: COVID-19’s impact on real estate advertising on Facebook
Share
Schedule a 30-min marketing strategy call with our team
Since March, our team has been dedicated to sharing knowledge that helps Agents and Brokers make educated decisions regarding Facebook and Instagram advertising during the Pandemic. To continue our promise to the real estate industry we have added another month-over-month analysis that compares April and May result data to our analysis.
Between February and May our team analyzed a subset of our real estate business that includes over 340,000,000 ad impressions and behaviors that have generated over 140,000 leads. The below analysis shows a unique advertising landscape that offers an unprecedented opportunity. As media costs remain at an all time low and buyer intent continues to surge, Agents and Brokers who understand how to navigate this landscape may reap substantial rewards.
Analysis Results
This data continues to describe an incredible story of low media cost and extremely high buyer engagement.
- CPM is showing its first increase since the 29% drop from February to March. This may be due to the return of some advertiser demand on the available impression inventory. However, our data (not included in the above chart) shows that CPMs remain 50% lower than they were in 2019. These historically low CPMs continue to create an amazing opportunity for agents and brokers.
- CVR continues to increase significantly, signaling extremely high buyer intent. Since February’s -18% decline of CVR, CVR is now up 49% compared to post-COVID data. The below seasonality analysis shows that this increase is well beyond business as usual.
- CTR shows its first sign of improvement with a 15% increase. This new spike in engagement, coupled with the historically low CPMs, and the still-increasing CVR, have dramatically decreased CPL by a total of 33%.
Seasonality Comparison
To better understand our current advertising environment our team conducted a seasonality analysis to better understand the unique landscape of real estate advertising.
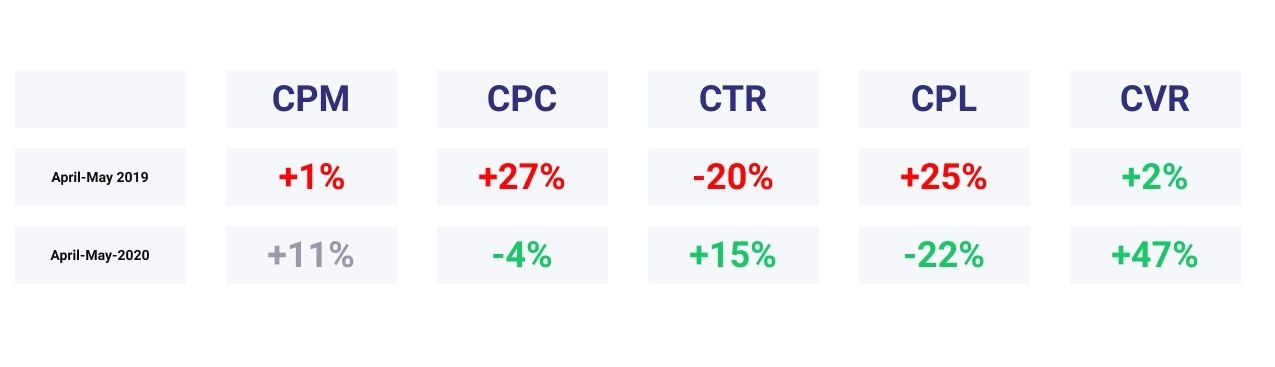
- Our first observations in the 2019 data is the large negative trend in CPC, CTR, and CPL. To describe our interpretation of this we must reference our last analysis that reported a 37% decrease in CPC, a 81% increase in CTR, and a 35% decrease in CPL in the 2019 data. At first glance the negative trend in the April-May 2019 may seem out of place, but we believe that’s reflecting a minor decrease from the previous month’s major seasonality boost. Also, the month of May brings two holidays (Mother’s Day and Memorial Day) that contribute to increased advertiser demand and higher media costs.
- The difference between 2019 and 2020 CTR, CPL, and CVR showcase the extreme difference in today’s advertising landscape on Facebook compared to 2019.
A regional look at month-over-month conversion rates
We believe CVR is the best metric to use when measuring buying intent. Simply put, the higher the CVR, the more motivated the audience is to start the home buying process. Below we have included two maps of the United States that show state-by-state breakdowns of CVR, with dark green showing low rates and dark red showing high rates.
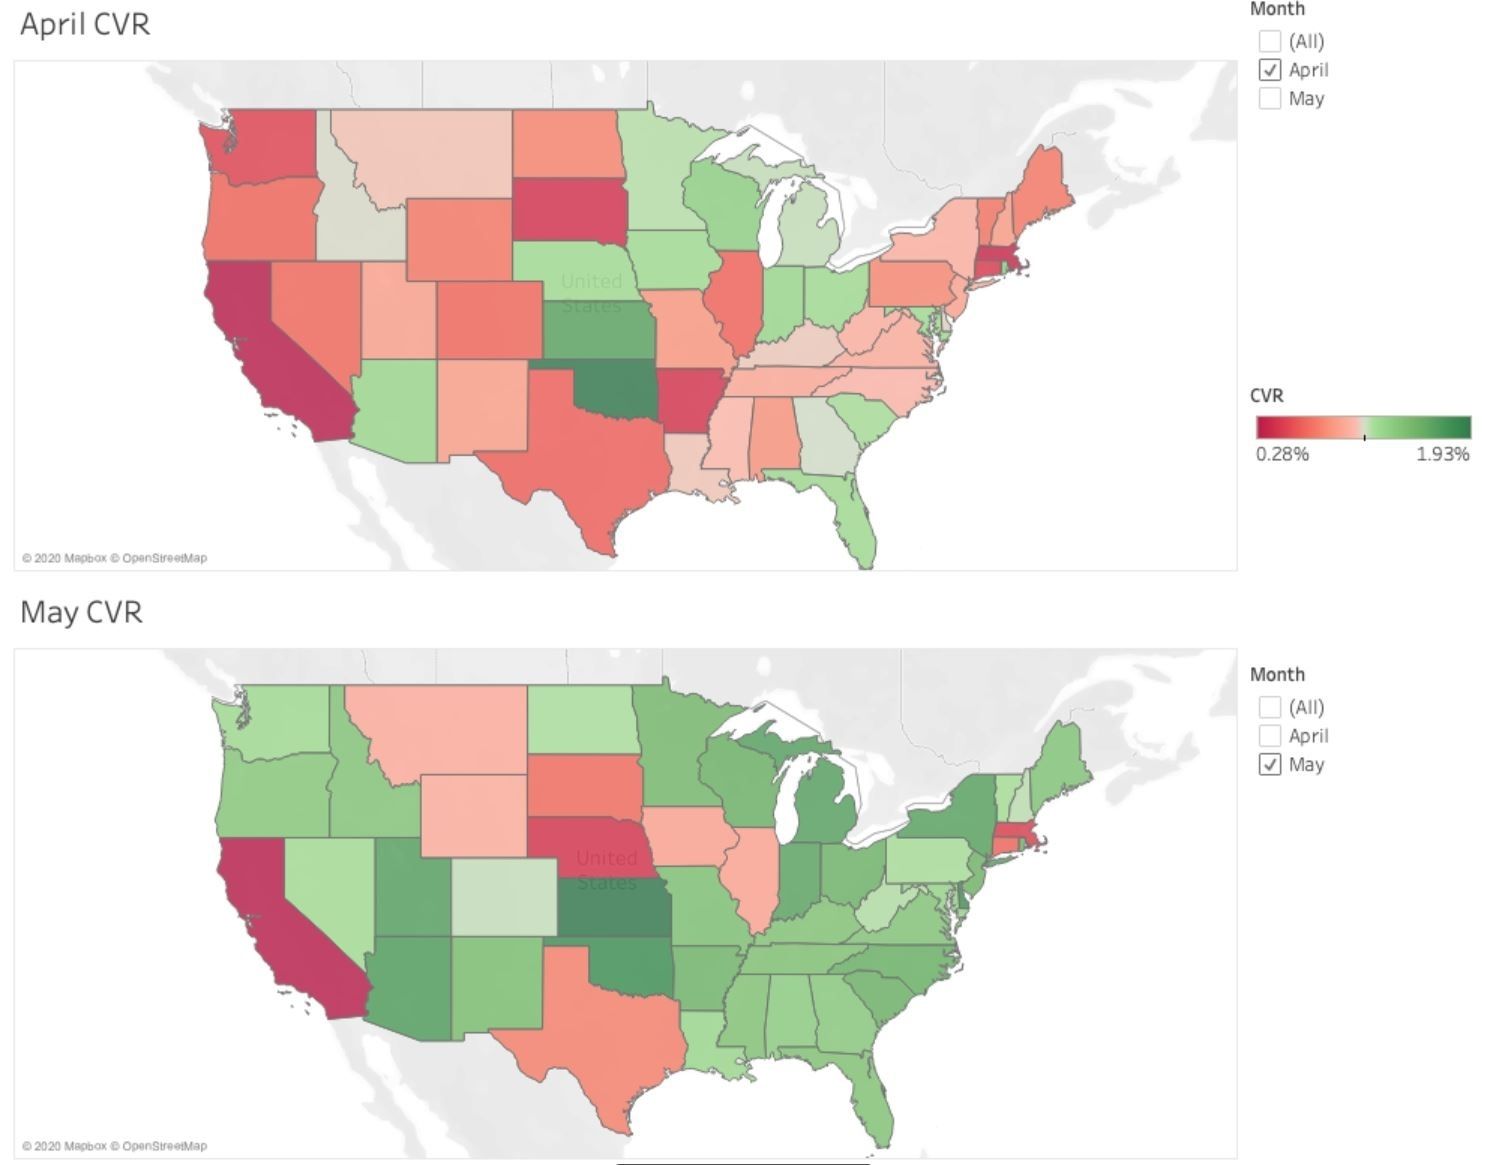
Comparing April CVR to May CVR it’s noticeable that high buyer intent has returned to the majority of states.
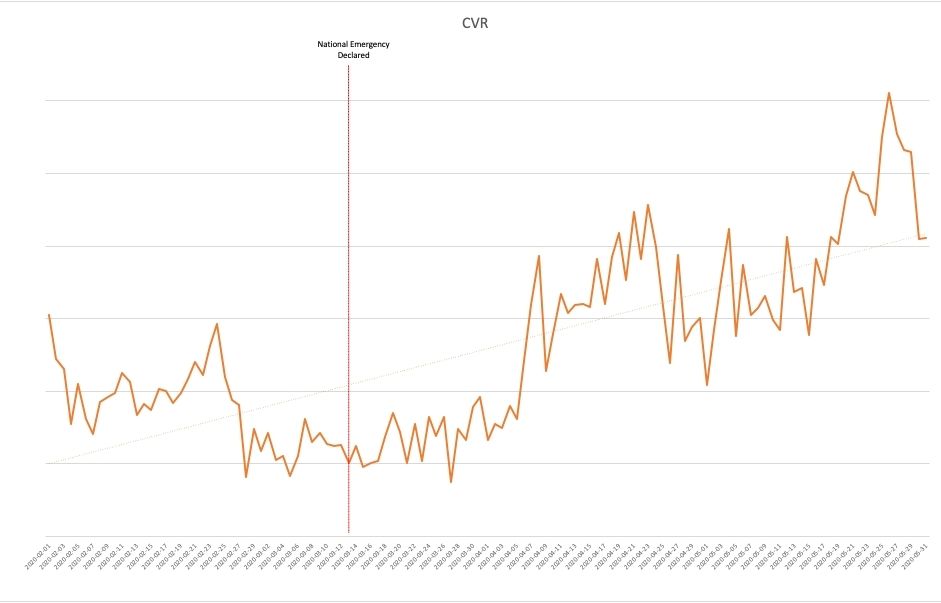
COVID-19 impact on real estate listing lead ad conversion rates
The below line chart is a day-by-day look at conversion rates for real estate listing ads on Facebook spanning from February 1 to May 31st 2020. COVID-19’s impact is clearly seen in the March time frame. The steady increase of CVR can also be clearly identified.
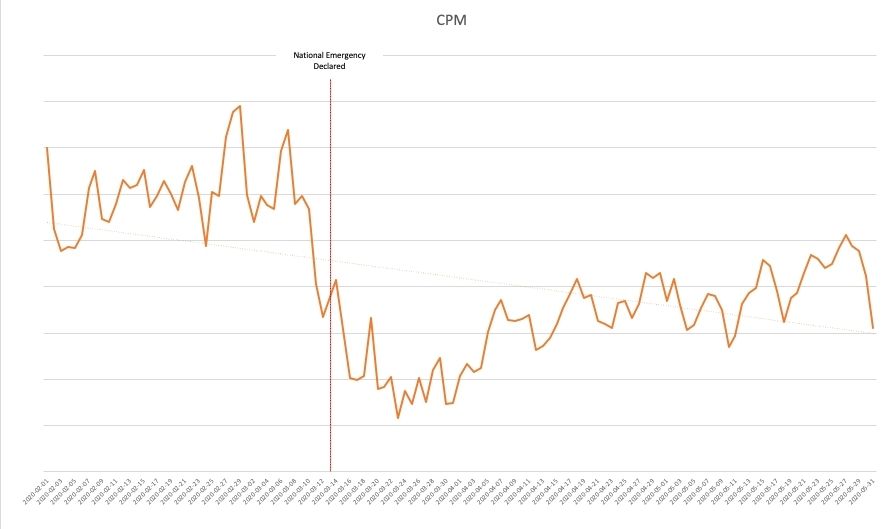
COVID-19 impact on the cost of media in the real estate industry on Facebook
The drop in media cost on Facebook is clear, along with its subsequent gradual increase. This chart also shows that a lot of movement is needed before media rates return to normal.
Share


Subscribe to our blog
Don’t miss a beat in the fast-changing local digital marketing landscape — sign up to stay ahead of the curve!