
May update: COVID-19’s impact on real estate advertising on Facebook
Share
Schedule a 30-min marketing strategy call with our team
Last month we published an impact report showcasing COVID-19’s impact on real estate advertising on Facebook’s family of apps and services. This month-over-month analysis used result data from a subset of the media spend leveraging our technology in the real estate industry. The subset includes data from 160 million ad impressions and behaviors that generated more than 70,000 leads during the period.
Today, COVID-19 continues to impact our lives and economy. To honor our commitment to help our partners, agents, and brokers navigate this uncertain landscape we have extended the analysis to include result data from April.
Below we have recapped our original findings and added new analysis based on March and April result data.
Summary of February and March month-over-month comparison
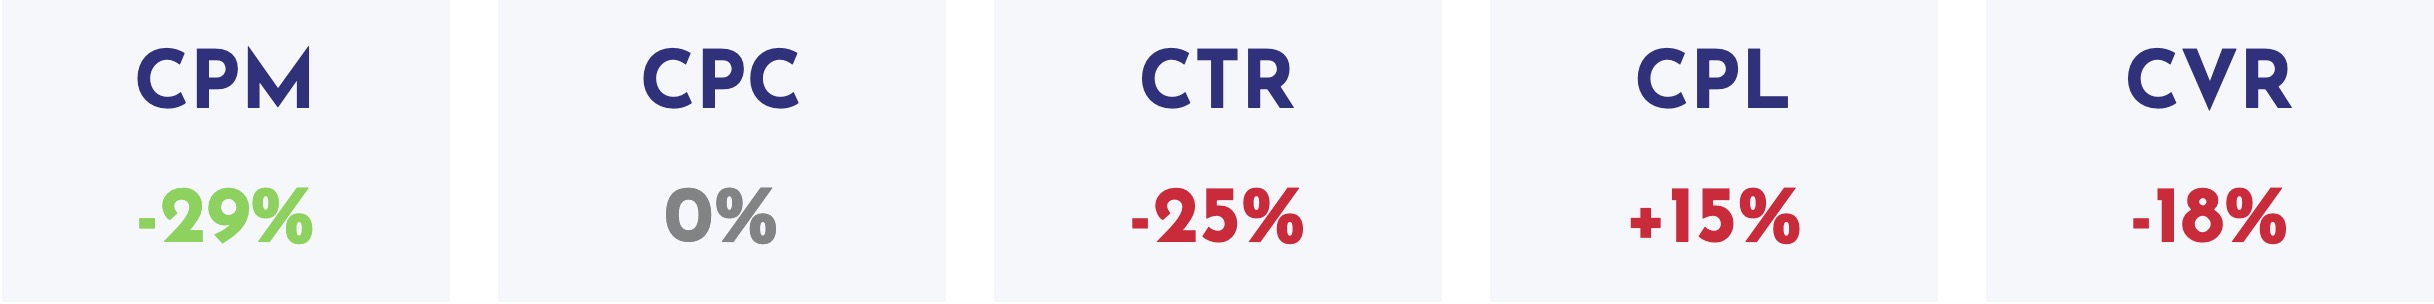
The results of our February vs March month-over-month comparison show cheaper media costs, albeit with lower clickthrough and lead conversion rates. Because 50% of home buyers and sellers choose to work with the first Realtor they meet in person or online, the net/net is that March was still a good time to build your brand and fill the top of your funnel.
March and April month-over-month comparison
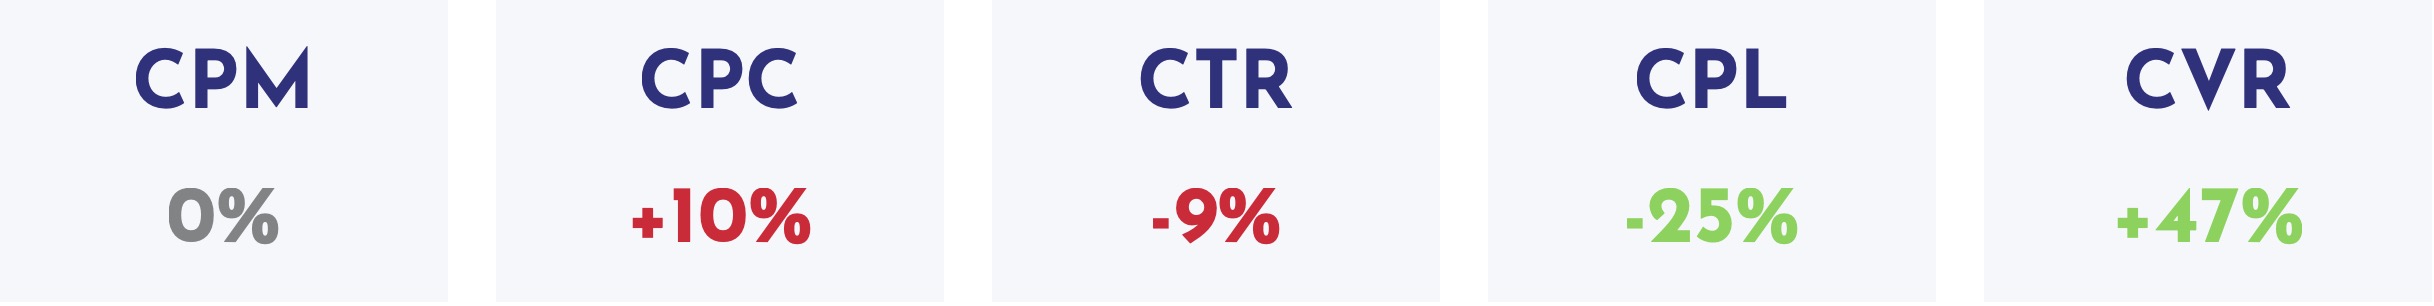
This data shows a completely different story than our last analysis. Here are 3 take-aways from the comparison.
1. The 47% increase in conversion rate (CVR) shows an extreme boost in buyer and seller intent. The drastic jump in conversion rate, coupled with the low cost of media, reduced the average cost per lead by an astonishing 25%.
2. Click through rates (CTR – a metric used to measure the rate in which an audience engages with an ad) continue to fall. With CTR’s falling 25% from February to March, then continuing to fall by 9% in April, overall CTRs are down 31% compared to a pre-COVID environment. It’s fair to say that fewer people are clicking on ads, but the people who are clicking mean business.
3. Media costs (CPM) remain at historic lows. With over 100 million ad impressions served we recorded a less than 1% change in media rates. Similar to March, inventory and usage in-channel remains high while advertisers continue to pause or decrease investment.
Seasonality’s effect on the March and April month-over-month analysis
Given that the real estate industry is quickly approaching spring buying season, our team wanted to understand if the extreme boost in buyer and seller intent was simply due to normal seasonality, or if it was driven by market changes due to COVID. To answer this question our analysts pulled data for the same period in 2019. The results are shown below.
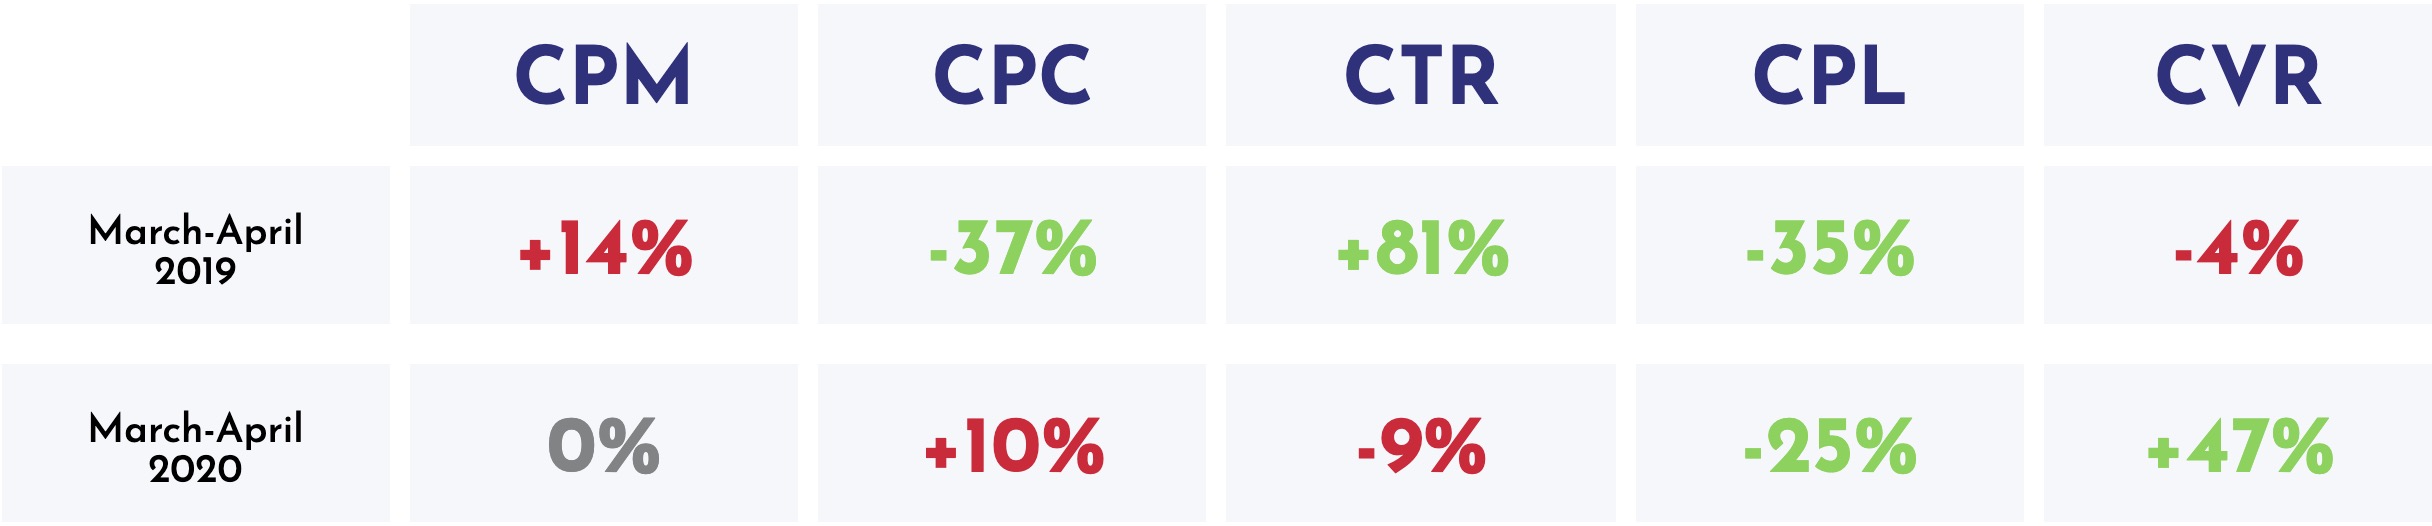
The chart shows that lead gen performance greatly improved moving from March to April. However, the key difference is that the 2019 increase was a result of more users engaging with the ads as measured by CTR. This means there were more people that wanted to browse and view houses, so they were clicking and engaging with the content.
In 2020, engagement continued to decrease month-over-month starting in February and moving all the way until April, but lead generation performance still improved (as measured by CPL) because conversion rate increased substantially. This means less people are engaging with the ads and the “home browsing” behavior that is common in the industry appears to be diminished with COVID.
In today’s pandemic impacted environment, if people are not in-market and ready to move, they will probably not click on listings ads or display home browsing behavior. However, for those that do click and engage, we saw a significant uptick in their willingness to convert on a lead basis as measured by CVR.
Looking toward the future, if CTR returns to normal and media rates stay low the positive effect this will have a on CVR and CPL will be profound.
A regional look at moth-over-month conversion rates
Conversion rates are the best metric to use when analyzing buyer intent. The map below displays a heat map of conversion rates broken down by state. Low conversion rates are represented in red and high conversion rates are represented in green. Comparing month over month data you can observe a shift in buyer intent.
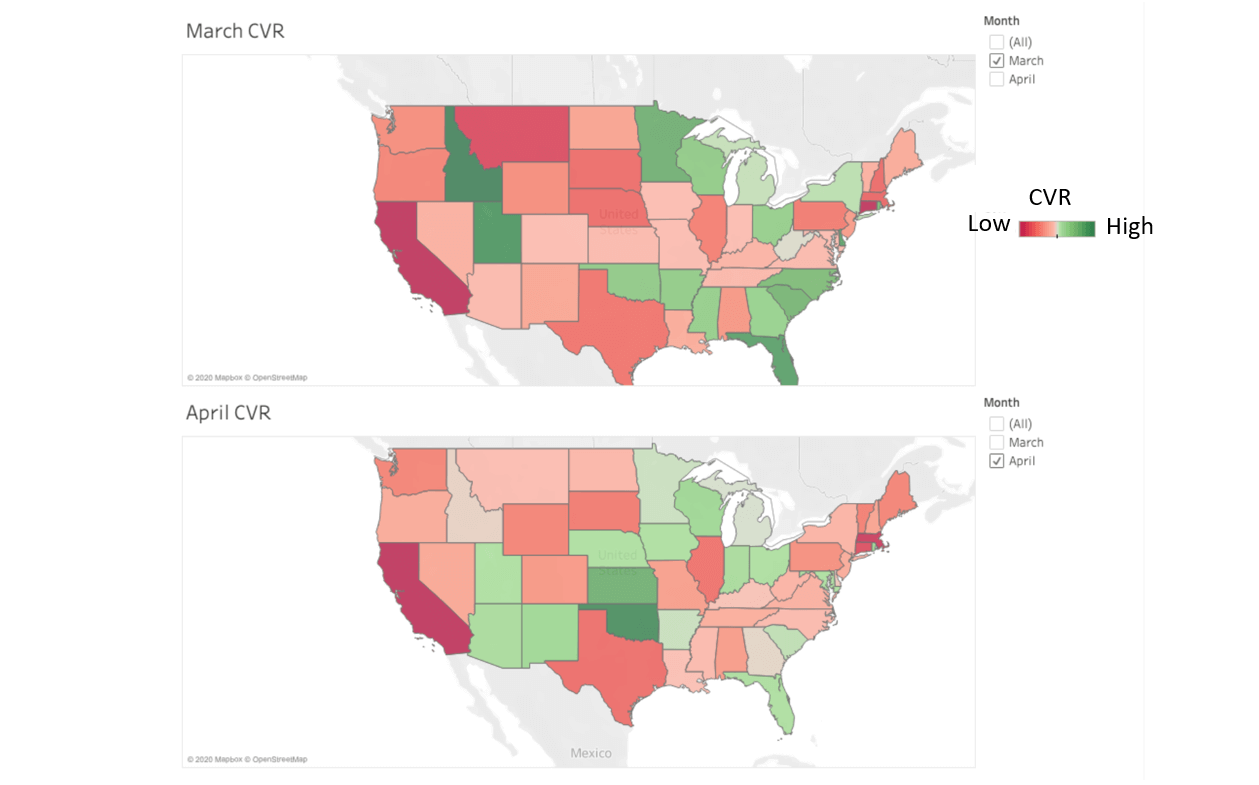
Here are some noteworthy takeaways from the maps.
- Idaho, Utah, and the south eastern states experienced a drop in conversion rates showing a decrease in buyer intent
- California and Connecticut remain unchanged
- In March, New York had higher signs of buyer intent then shifted to show the lower intent
- Buyer and seller intent in the MidWest shifted from low to high.
Advertisers running national programs can use this data to understand how to adjust budgets between campaigns with lead generation and branding/awareness objectives.
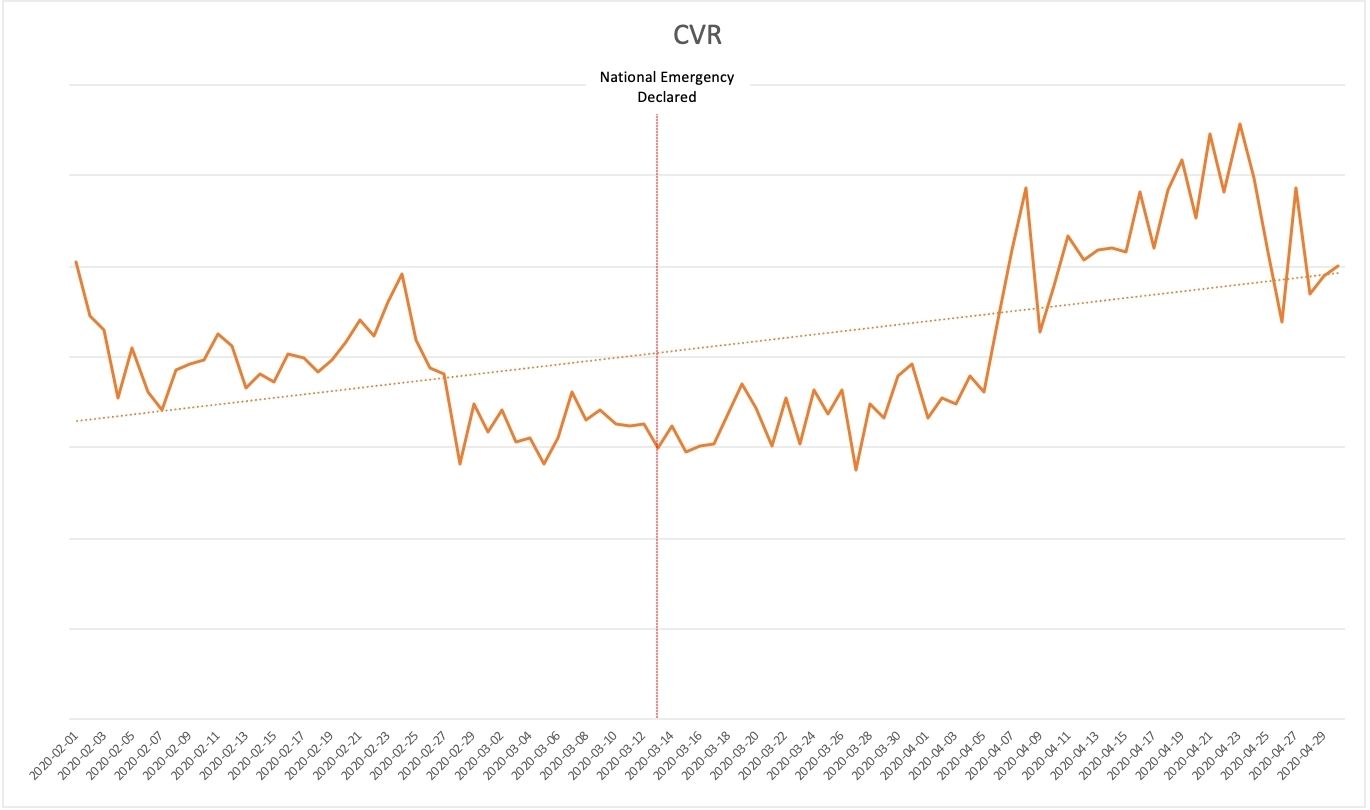
COVID-19 impact on conversion rates
The below line chart shows the extreme jump in conversion rates in April. It’s clear that conversion rates dipped in the month of March, then exceeded pre-COVID levels during the month of April signaling the strong return of buyer and seller intent.
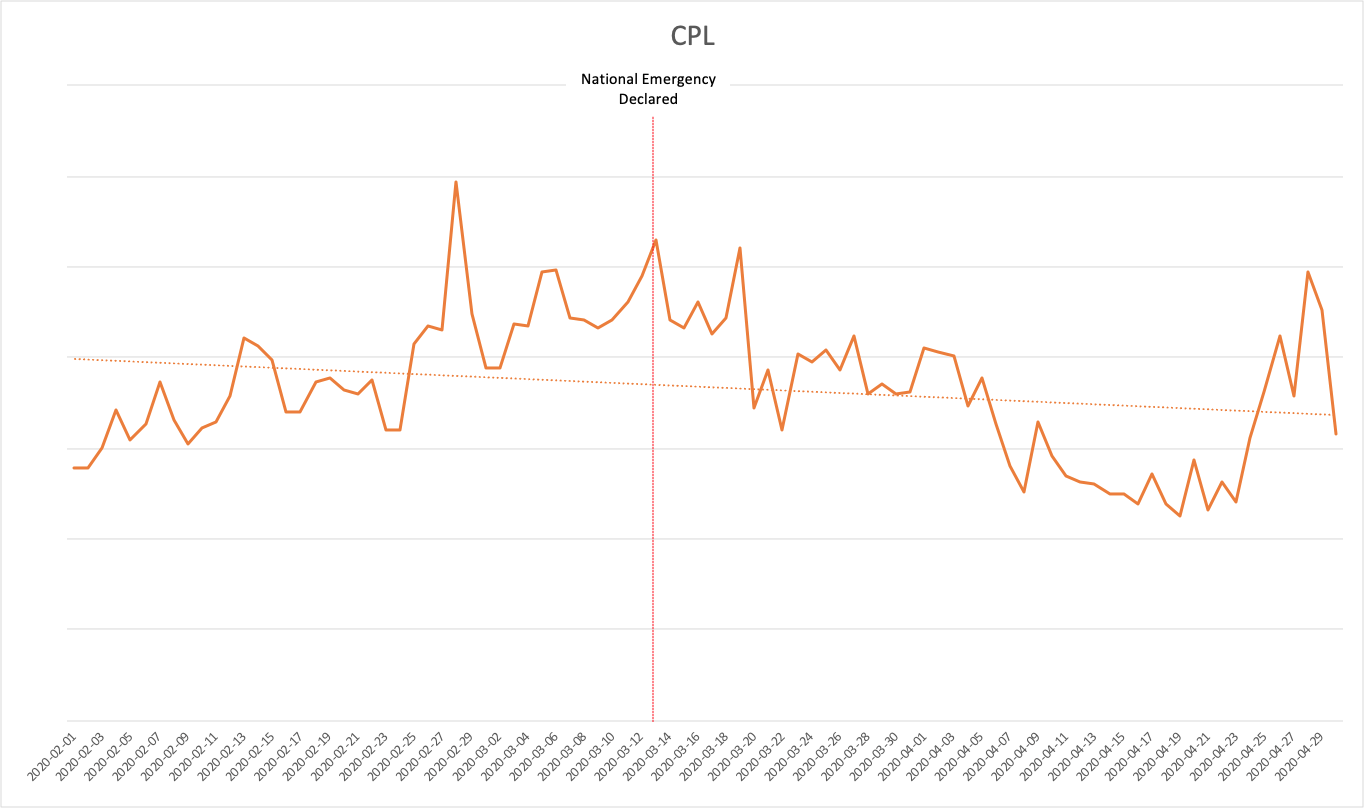
COVID-19 impact on the cost per lead
The cost per lead dropped and remained low in the month of April. The rapid spike and drop of CPL towards the end of the month is most likely attributed to increased advertising competition as companies are overspending to fulfill their monthly budgets and not COVID-19 related.
COVID-19 Impact on the cost per 1000 ad impressions
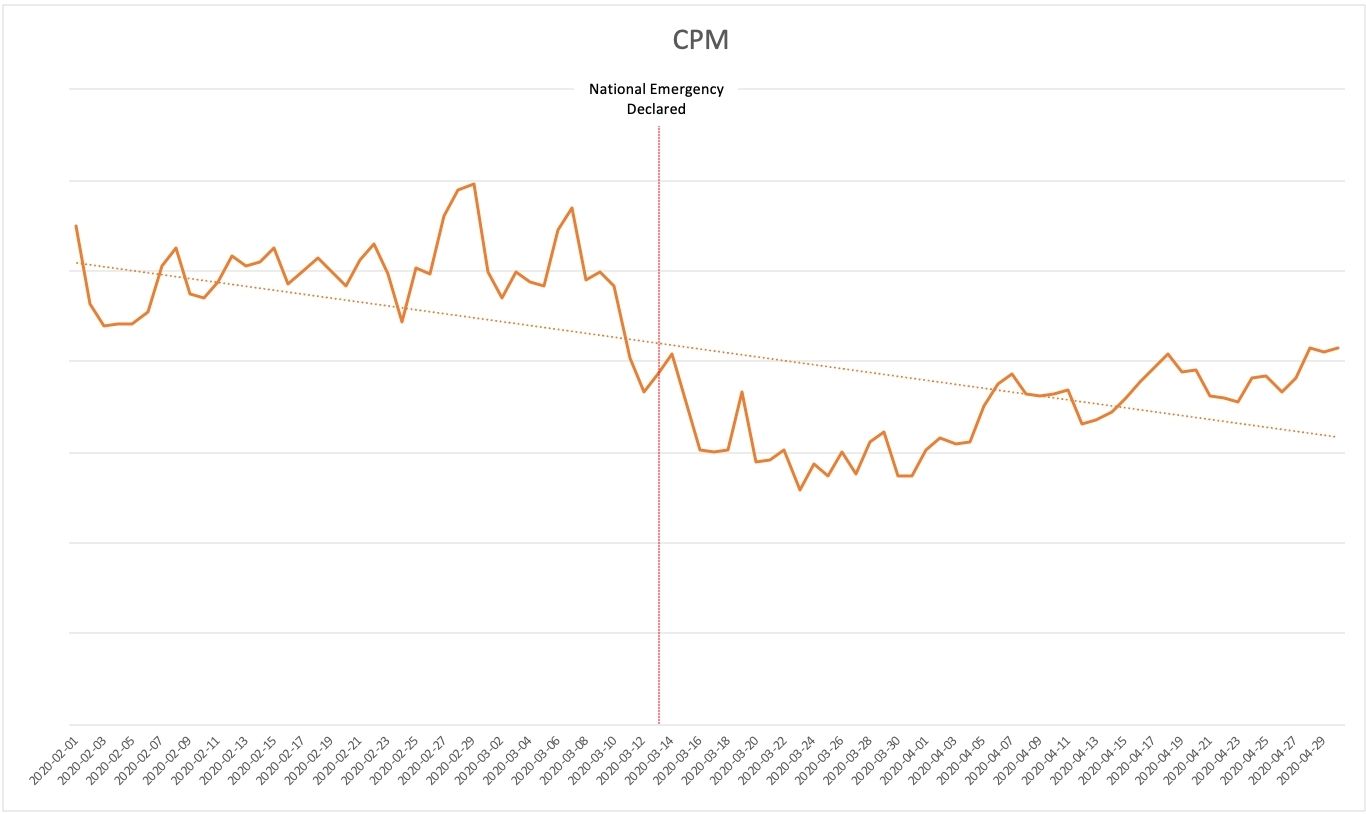
The line chart above shows that March 23rd represented the day with the lowest CPM. From this point CPM rates gradually increase. If this trend continues it’s possible that CPM rates will return to normal in the next 3-4 months.
About Evocalize
Evocalize is a graduate of the National Association of Realtors®️ REACH program, the #1 startup accelerator in real estate. Our solutions provide embedded online marketing technology for CRMs, portals, marketplaces, and multi-location brands that enable users with sophisticated, data-driven online marketing tools. Through our leading clients in the real estate industry, our technology has helped agents and brokers run more than 500,000 local performance marketing programs on Facebook and Google.
Share


Subscribe to our blog
Don’t miss a beat in the fast-changing local digital marketing landscape — sign up to stay ahead of the curve!